


Domestic Oil Production Growth and Lower Net Imports
Bob Greco
Posted April 30, 2013
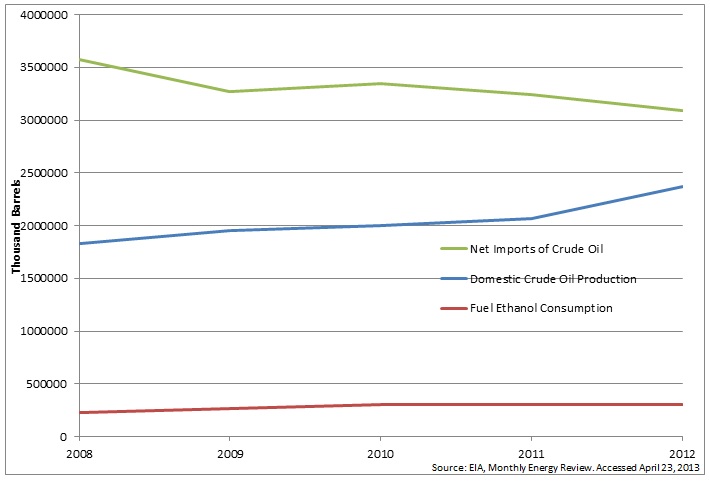
Imports of crude oil have decreased significantly over the past four years as the U.S. has become more self-reliant in meeting its energy needs domestically. In fact, as the graph below shows, from the beginning of 2008 through the end of 2012 net U.S. oil imports have declined by more than 1.3 million barrels per day (bpd) while domestic production has increased by almost 1.5 million bpd. In short, the increase in domestic production accounts for all of the reduction in imports and then some.

The 2008-to-2012 timeframe is especially significant, because the Energy Independence and Security Act of 2007 (EISA 2007), which set the required ethanol volumes for the current Renewable Fuel Standard (RFS), was signed into law Dec. 19, 2007.
Here’s the point: The ethanol industry and its proponents like to claim that the RFS is working exactly as it was intended and point to the sharp reduction in imports since the RFS’ passage as proof. The truth is that while ethanol production increased by 260,000 bpd since the current RFS was enacted, that level of production is too small to deserve credit for reducing imports – not when domestic oil production growth accounts for all of the import reduction and more.
The EISA 2007 goal to move the United States toward greater "energy independence and security" was the right one. But, at the time the bill was passed by Congress and signed by the president, no one knew that we would soon discover vast, accessible domestic oil supplies. Without government support, or a law requiring it to act, the oil and natural gas industry has moved the country toward greater “energy independence and security” as called for in EISA 2007 while pouring $57.5 billion in rents, royalties and bonuses into the U.S. Treasury - not to mention more than $34 billion in income taxes from 2008–2010 in addition to billons more in still-to-be-released tax numbers for 2011 and 2012.
This chart provides another look at the inverse relationship between domestic production and imports of crude oil. At the bottom you can see the line tracking fuel ethanol consumption. While the line inches slightly north, it has no role in the big picture you see toward the top of the chart.
There are a number of ways to explain that domestic production, not the RFS, is responsible for reduced crude oil imports over the past five years. But in this case, pictures – or better, graphs – speak far louder than words.