


Strong Economic Indications: API’s New D-E-I

Dean Foreman
Posted April 18, 2019
Although we often say energy and economic growth go hand-in-hand, it’s refreshing to highlight tangible examples. API’s new economic indicator, which was first released December 2018, is one to watch.
For the past four months, API’s Distillate Economic Indicator (DEI) has correctly anticipated changes in total U.S. industrial production, which is important to the U.S. economy and ultimately things like jobs, interest rates and the exchange value of the U.S. dollar.
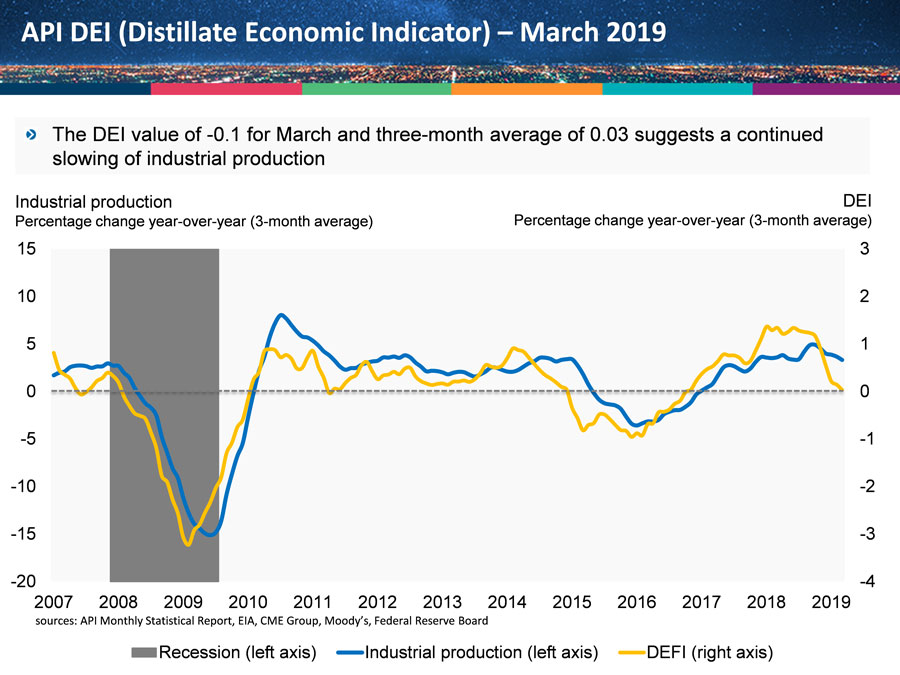
What’s in a name? The term “distillate” is not as commonly recognized as “diesel,” but when crude oil is refined into fuels and other products, “distillates” typically represent about 30 percent of the output from a barrel including motor fuel and fuel oil products, most of which are sold as diesel fuel. Since diesel and fuel oil are widely used in transportation and manufacturing, it will not surprise you that the shifts in demand and inventories of distillates could be significant economic indicators.
In general, individual industries may tend to lead, lag, or concurrently follow the broader economy. If an industry or its major products have consistently led economic cycles, its key indicators – that is, supply, demand, inventories and prices – could offer information about turning points for the economy.
The National Bureau of Economic Research (NBER) identifies turning points in the U.S. economy and demarcates whether periods have expanded or contracted. These turning points are the business cycle peaks and troughs, and the natural gas and oil industry has products that have tended to move with or lead turns in the economy.
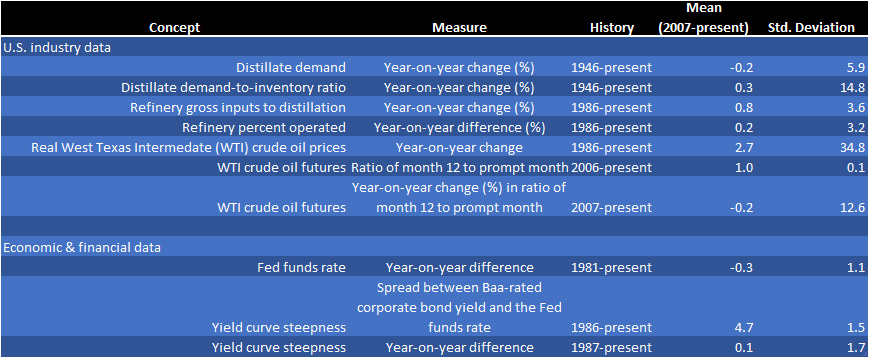
What’s unique about API’s DEI? For its Weekly Statistical Bulletin (WSB) and Monthly Statistical Report (MSR), API regularly gathers and analyzes industry data on U.S. crude inventories and refinery operations, including the production, international trade, and inventories of all major petroleum products. While the WSB is a premium subscription product of interest and value to market participants, we have been making our monthly estimates freely available (linked here), two months ahead of monthly data from the U.S. Energy Information Administration (EIA). Additionally, we decided to turn these data into a useful indicator, with a couple of additional considerations of prices and interest rates – risk “on” or “off” -- as follows:
Table 1. API DEI data inputs
It’s still early days, but the indicator is performing well and in line with our expectations. Please follow the API DEI in the Monthly Statistical Report!
About The Author
Dr. R. Dean Foreman is API’s chief economist and an expert in the economics and markets for oil, natural gas and power with more than two decades of industry experience including ExxonMobil, Talisman Energy, Sasol, and Saudi Aramco in forecasting & market analysis, corporate strategic planning, and finance/risk management. He is known for knowledge of energy markets, applying advanced analytics to assess risk in these markets, and clearly and effectively communicating with management, policy makers and the media.