


MSR: Markets are Rebalancing, Though Uncertain Road Lies Ahead

Dean Foreman
Posted September 17, 2020
Sometimes, through the headlines, it can be hard to see that the economy and oil markets recently have made noteworthy progress toward rebalancing and normalizing – which is encouraging news for the industry, the country and consumers.
While petroleum demand remains below where it was this time a year ago and is likely to stay below 2019 levels until the latter half of 2019, according to the U.S. Energy Information Administration (EIA), signs are visible of a recovery from lows earlier this year.
As discussed in this post last week, petroleum demand has remained a reliable indicator of economic activity with broad applicability, and the latest API Monthly Statistical Report (August 2020 data) confirms continued recovery and diverging movements of inventories.
Specifically, API’s primary data on U.S. petroleum markets for August showed that demand increased and supply decreased, while Gulf Coast refineries, petrochemical plants and export terminals also weathered the seasonal disruptions due to Hurricane Laura. Now, with Hurricane/Tropical Storm Sally further affecting Gulf Coast production, September data also are likely to show disruptions to typical activity.
Despite the disruptions, crude oil and refined product exports rose during the month, while imports fell. This is significant for a couple of reasons. First, refiners have increasingly utilized domestic sweet crude oil despite the COVID-19 recession – and, in fact, because of it. Moreover, the shift also has impacted the U.S. trade balance for crude oil and refined products. Between May and July, the U.S. had been a petroleum net importer, but in August the U.S. was a petroleum net exporter for the month.
The petroleum trade balance is one gauge of U.S. energy security, and August data show that we’ve met domestic needs while simultaneously adding economic value through exports, while prices have remained low. This includes gasoline prices, which we’ll discuss below.
With the increased activity and trade, crude oil inventories also fell against an economic backdrop that has broadly improved.
In other words, substantive progress toward economic, energy and oil market recovery appears to have continued, consistent with economic indicators that also broadly improved, including API’s D-E-IP™P (distillate/diesel economic indicator), the University of Michigan’s consumer sentiment index and U.S. employment metrics.
Highlights from this month’s MSR shows, based on August data:
- U.S. petroleum demand – 18.3 million barrels per day (mb/d) – continued to recover.
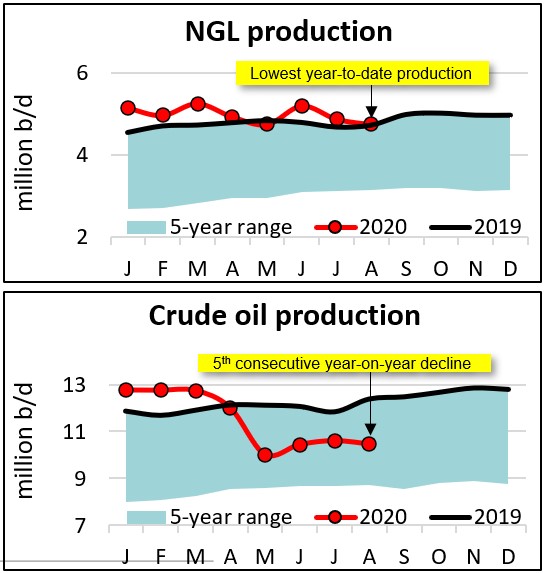
- U.S. crude oil supply edged down to 10.5 mb/d on productivity gains and less drilling activity.
- Refinery throughput (14.8 mb/d) slipped, but capacity utilization (79.6%) rose with Hurricane Laura.
- Lower U.S. petroleum imports and higher exports returned the U.S. to being a petroleum net exporter.
- While crude oil inventories continued to fall, refined product storage reached record highs for the month.
As many people have been unable to fly or reluctant to take public transit due to the pandemic, driving activity has re-accelerated. A main indicator is motor gasoline demand, as measured by deliveries, which rose to 8.8 mb/d in August, up by 3.0 mb/d since its low point in April.
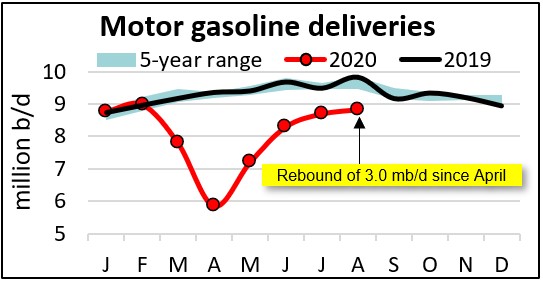
Of course, low gasoline prices also have helped support demand. The U.S. average conventional gasoline price held steady at $2.27 per gallon in August, down by 16.1% ($0.44 per gallon) from August 2019, according to AAA.
As demand has recovered, supply edged down in August, driven by record well productivity amid less drilling in many producing basins, per EIA. U.S. crude oil production decreased to 10.5 mb/d, which was 2.4 mb/d off its peak in November 2019 but still nearly twice as much as a decade ago.
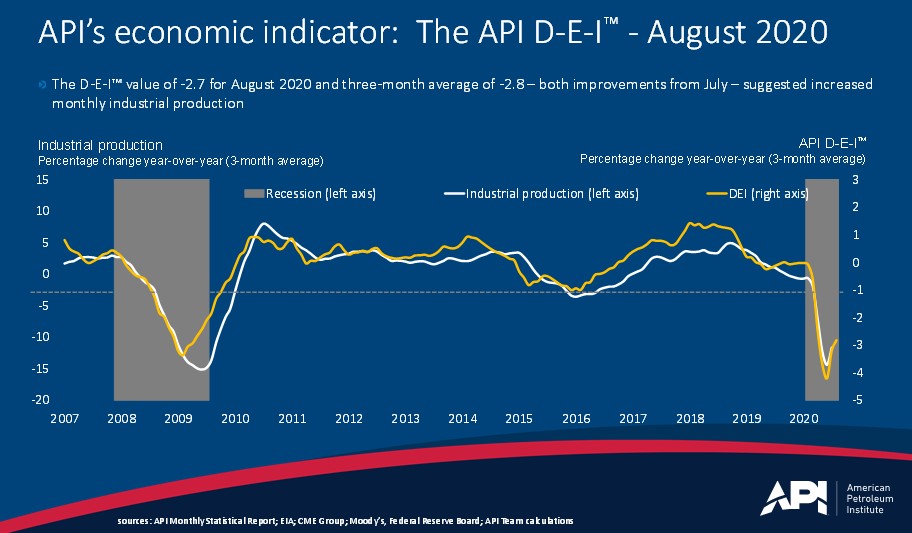
In our summary of last month’s MSR, as discussed here, we identified a potential economic turning point based on API’s D-E-IP™P(distillate/diesel economic indicator), and August data confirmed that change of direction toward a re-acceleration in industrial production. Again, this industrial revival is good news for the economy and individual Americans working in those sectors.
A final noteworthy point – and the bottom line for many oil traders – concerns diverging movements in U.S. crude and refined products that continued to widen in August.
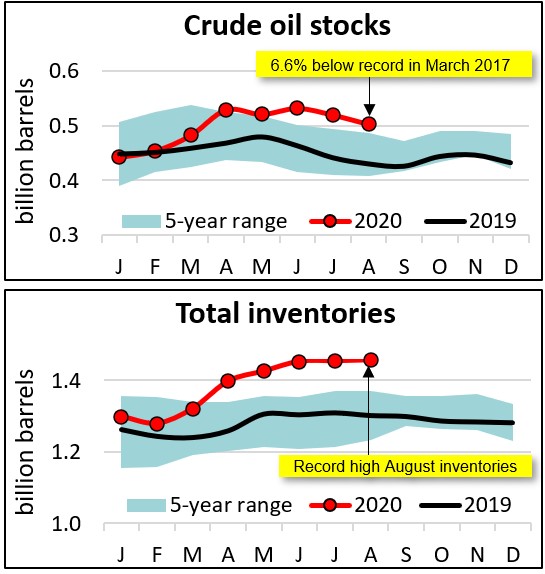
U.S. total petroleum inventories, including crude oil and refined products, but excluding the Strategic Petroleum Reserve, were 1.46 billion barrels in August. This was an increase of 0.2% from July and a record for the month of August.
Meanwhile, crude oil stocks of 502.8 million fell by 3.2% month over month (m/m) and stood 6.6% m/m below the record in July 2020.
Again, there are indications the markets are rebalancing, which we would expect by basic economics – even with the pandemic’s impacts. It’s not an instantaneous recovery, but it appears to be a substantive one when we take stock of the real progress toward recovery achieved so far.
About The Author
Dr. R. Dean Foreman is API’s chief economist and an expert in the economics and markets for oil, natural gas and power with more than two decades of industry experience including ExxonMobil, Talisman Energy, Sasol, and Saudi Aramco in forecasting & market analysis, corporate strategic planning, and finance/risk management. He is known for knowledge of energy markets, applying advanced analytics to assess risk in these markets, and clearly and effectively communicating with management, policy makers and the media.