Regularly updated with new charts and explanations that help make sense of a complex and ever-changing industry. Brought to you by the experts at API. Come back regularly for new content. For questions please contact: press@api.org.
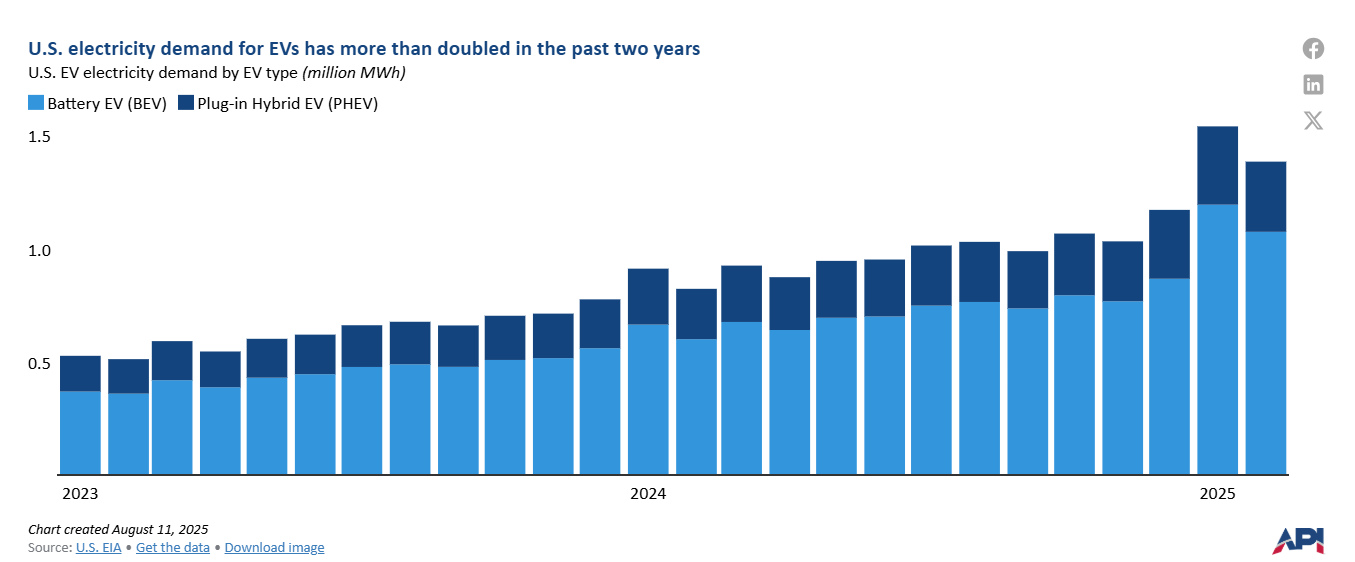
In 2024, EVs consumed 11.7 million megawatt-hours (Mwh) of electricity in the U.S., increasing 55% year-on-year.

According to the Bureau of Labor Statistics (BLS), non-retail oil and natural gas sector employees made an average of $135,000 in 2024, which is 77% higher than the U.S. average annual pay.
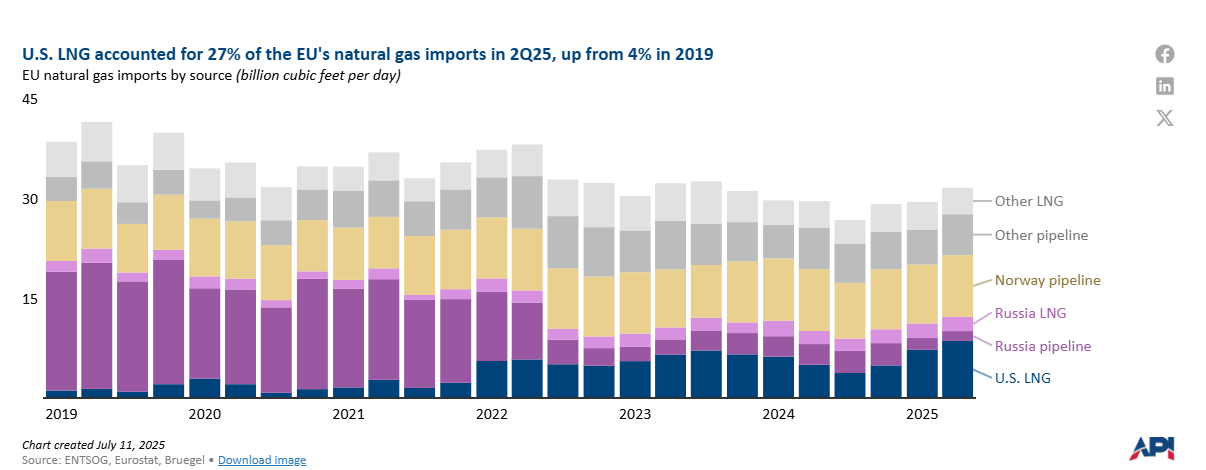
U.S. LNG has played an increasingly important role in Europe’s energy mix with the U.S. accounting for 27% of the EU’s total natural gas imports in 2Q25, up from 4% in 2019.
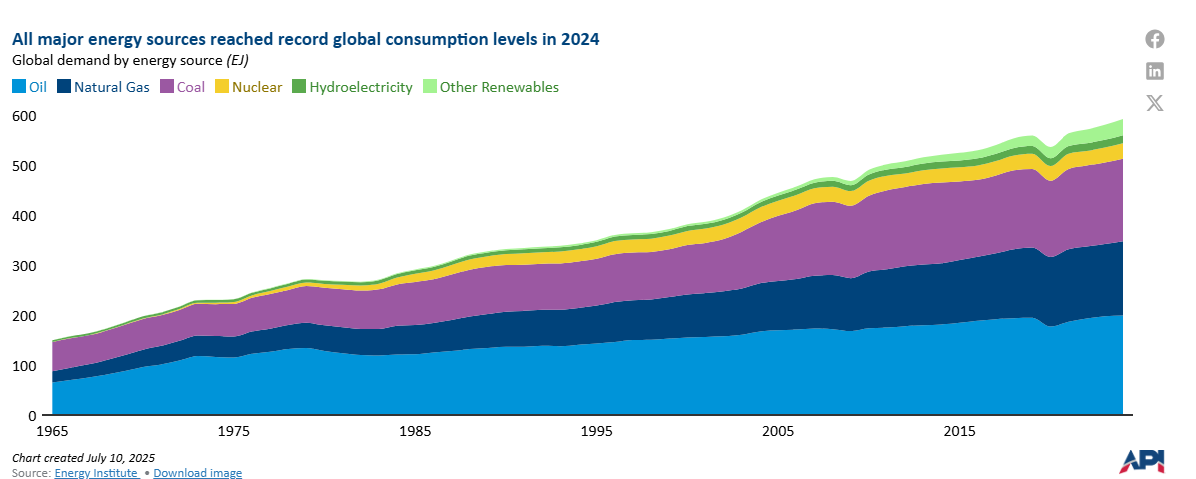
Energy Institute data shows consumption levels for all major energy sources reached record levels in 2024, including oil, natural gas, coal, nuclear, hydroelectricity, solar, wind, biofuels, and other renewables.
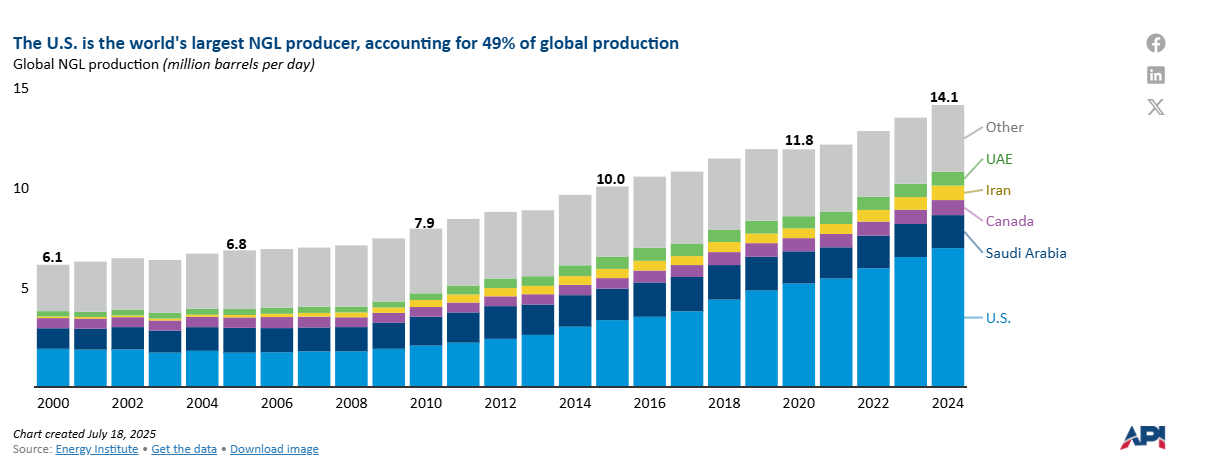
The U.S. accounted for 49% of global natural gas liquids (NGLs) production in 2024 and produced more than four times the amount of the second largest producer, Saudi Arabia.
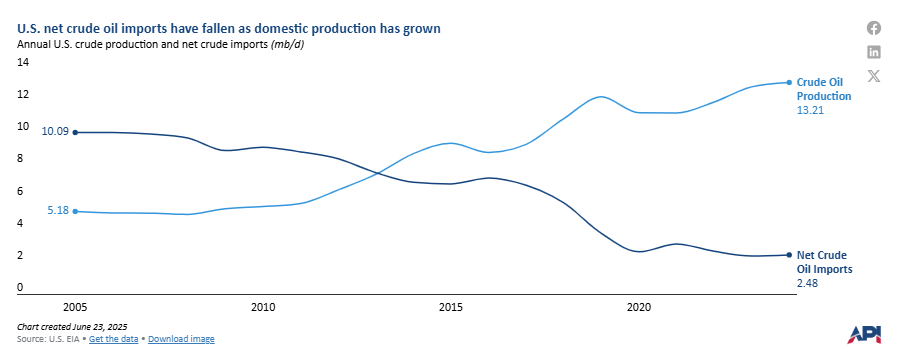
Over the past decade, domestic crude oil production has grown by 50% while net crude oil imports have fallen by 65%.
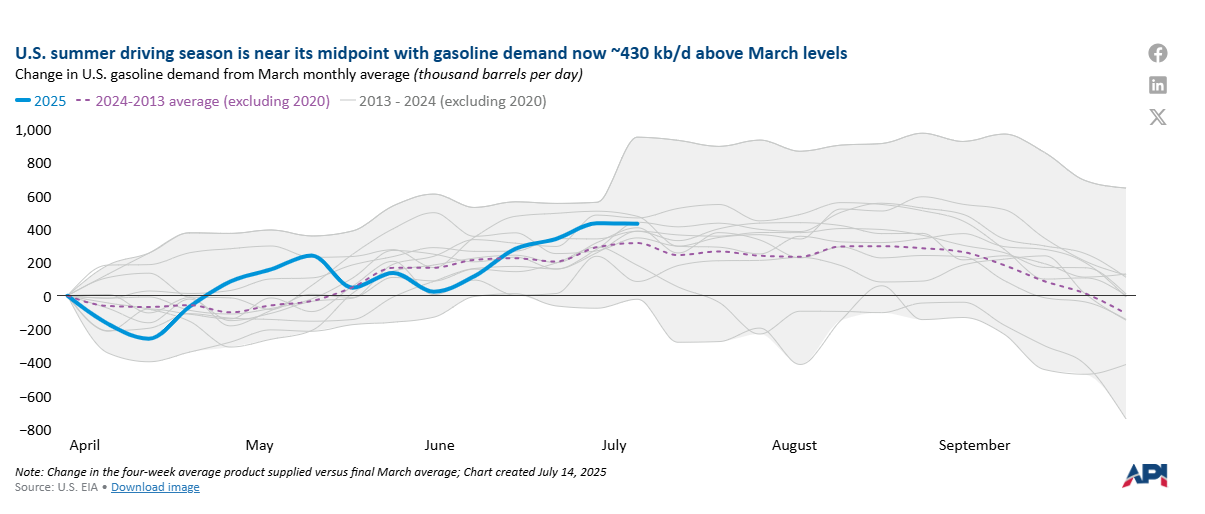
EIA’s preliminary weekly data shows gasoline demand in early July was up ~430 kb/d compared to March’s average demand level. This is slightly more than the seasonal average change for the period (+315 kb/d).
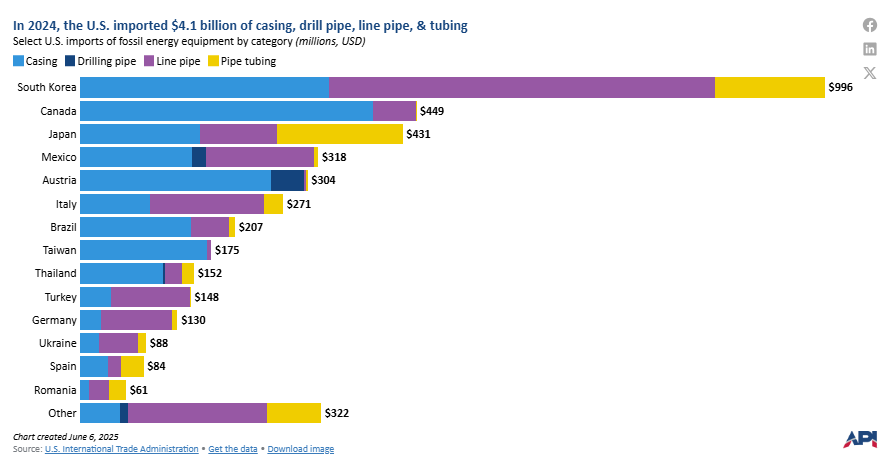
The U.S. oil and natural gas industry uses both domestic and imported steel products in its operations. Many of the imported products are specialized with few or no domestic substitutes.
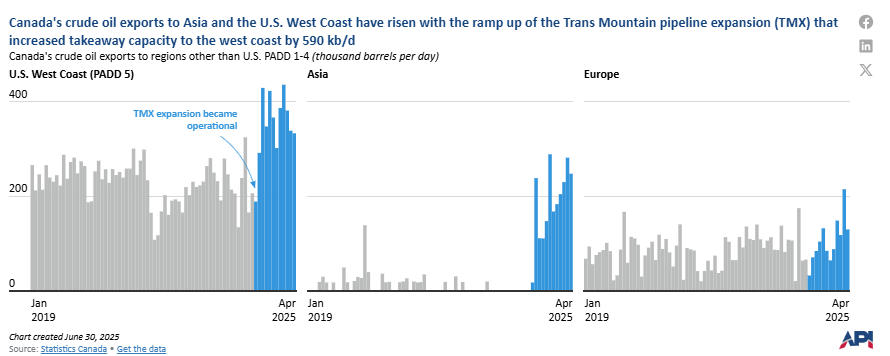
The Trans Mountain pipeline expansion added 590 kb/d of crude oil takeaway capacity between Canada’s oil producing fields in Alberta and the Port of Vancouver on the west coast.
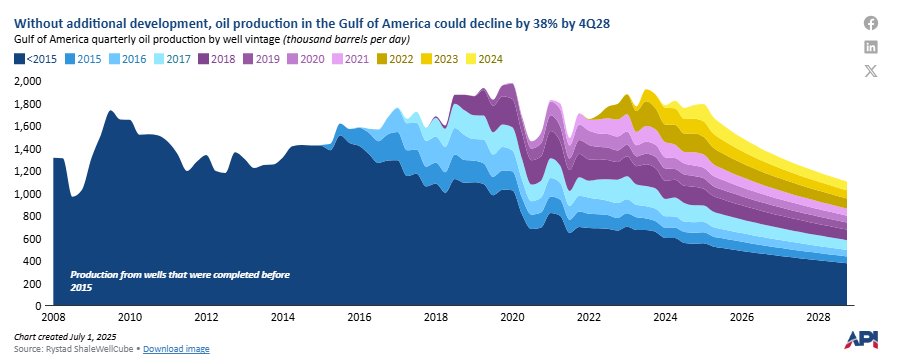
Without new drilling, crude oil production can quickly decline. For example, in the Gulf of America, if all new drilling stopped, crude oil production could decline from 1.8 mb/d in 1Q2025 to 1.1 mb/d by 4Q2028, according to Rystad data.

