Regularly updated with new charts and explanations that help make sense of a complex and ever-changing industry. Brought to you by the experts at API. Come back regularly for new content. For questions please contact: press@api.org.
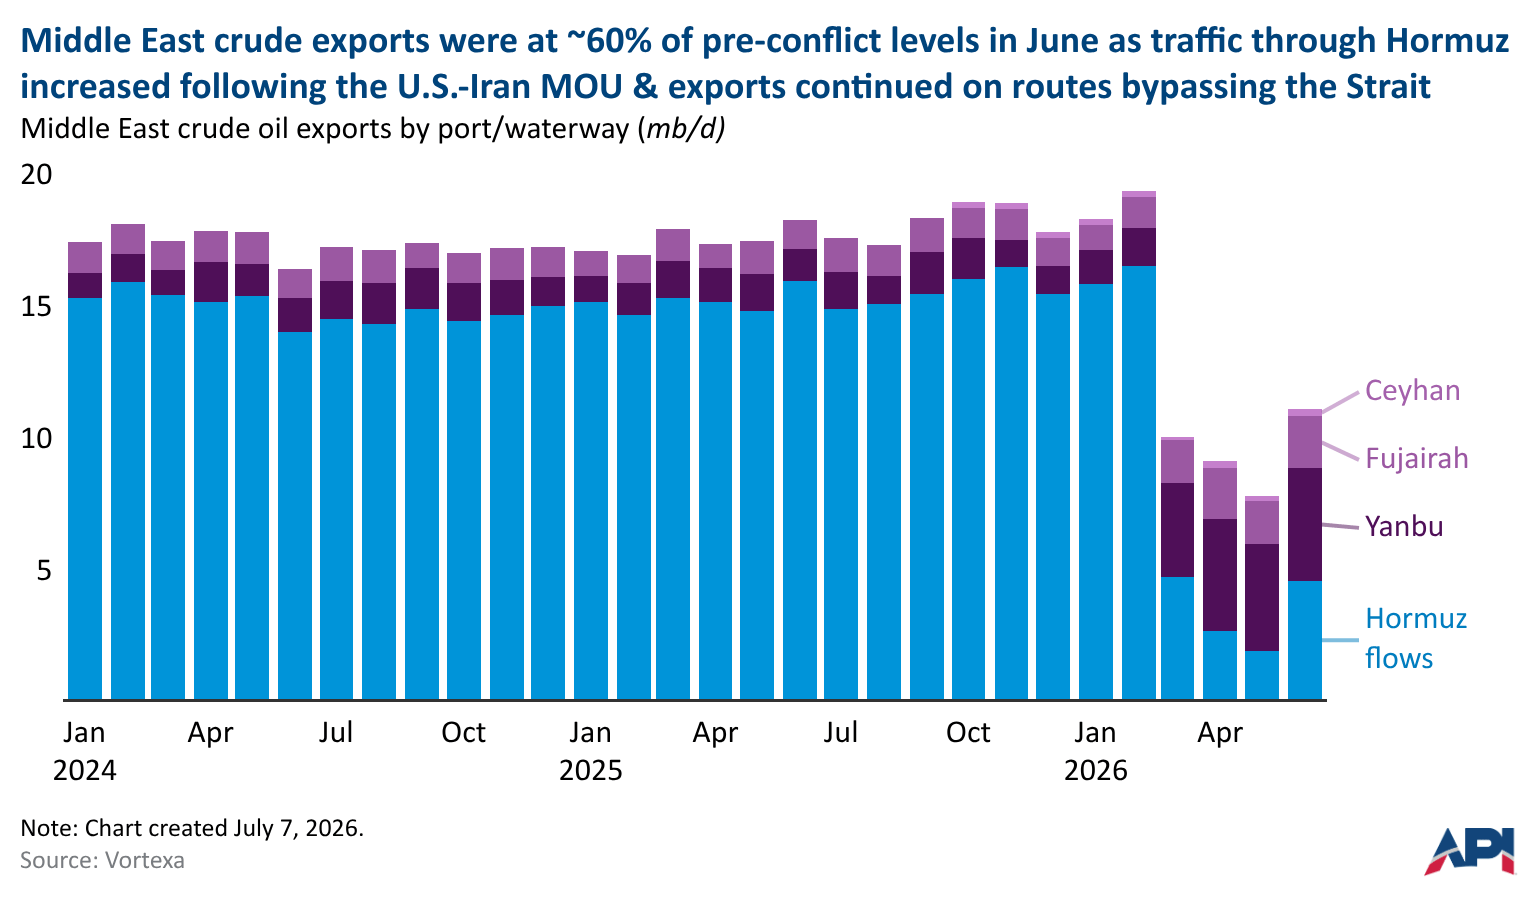
Before the near-total closure of vessel traffic through the Strait of Hormuz, 15–16 million barrels per day (mb/d) of crude oil flowed through the waterway. Since March, loadings at two Middle Eastern ports that bypass Hormuz—Yanbu on Saudi Arabia’s west coast and Fujairah on the United Arab Emirates’ east coast—have more than doubled to ~5.8 mb/d, helping to partially offset flows disrupted through the Strait.
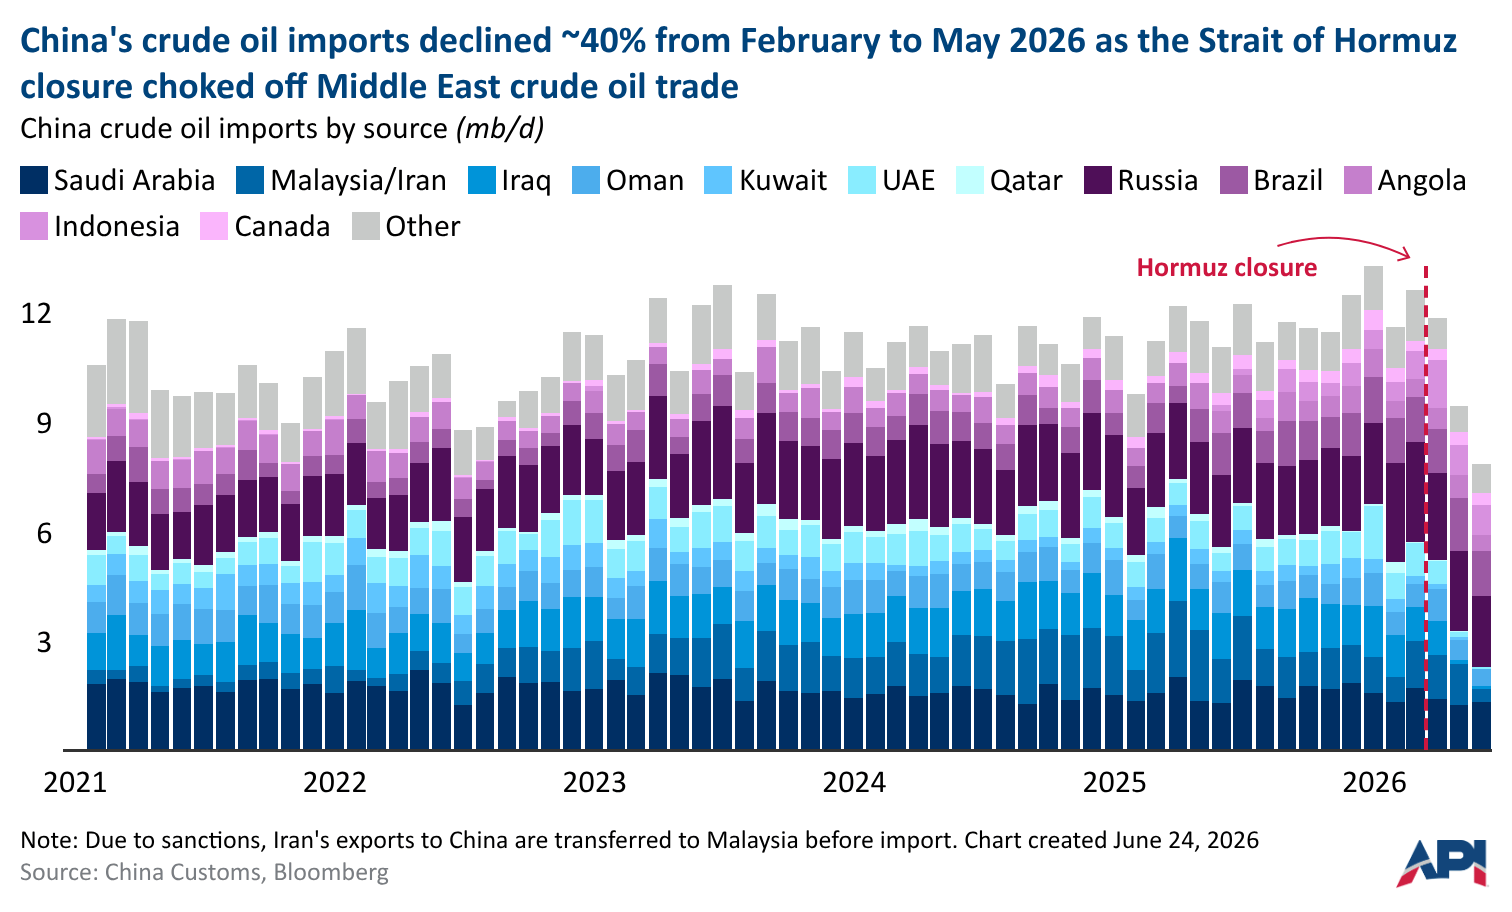
China is the world’s largest crude oil importer, but its imports have fallen sharply amid the near-closure of vessel traffic through the Strait of Hormuz.
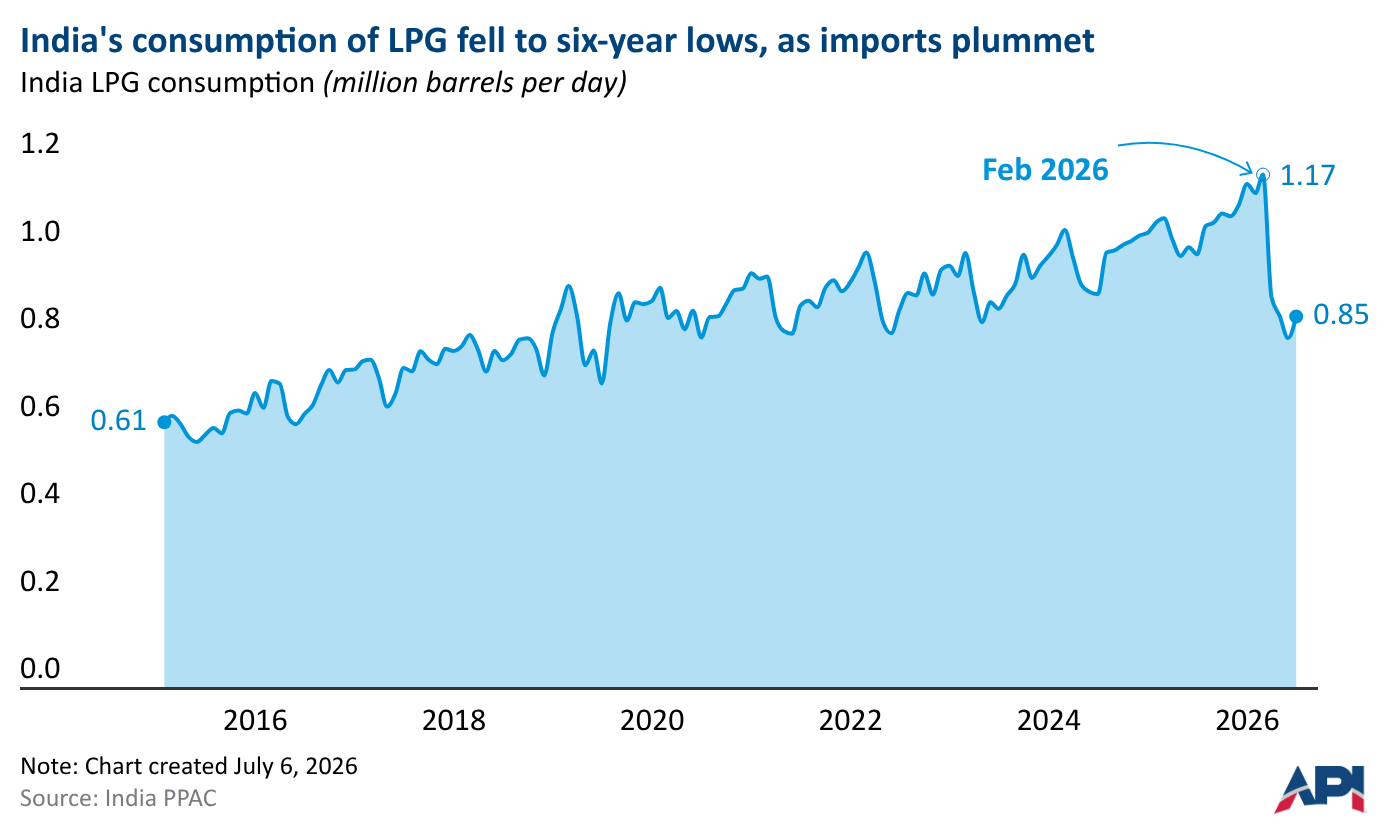
India imports most of its liquefied petroleum gas (LPG, a blend of propane and butane) from the Middle East, leaving it exposed to the near-complete closure of vessel traffic through the Strait of Hormuz. Based on estimates from Vortexa, India’s LPG imports from the Middle East declined ~85% from February 2026 to June.
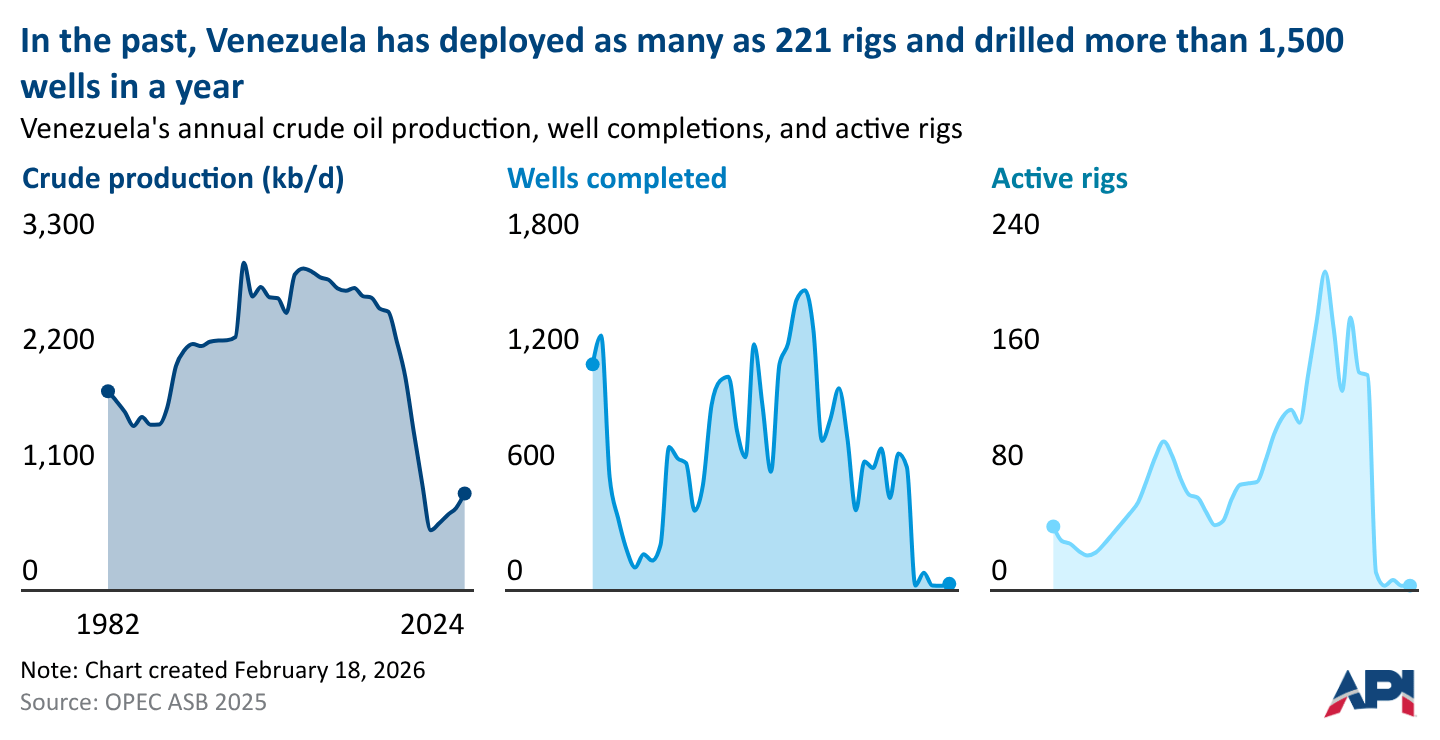
Venezuela’s oil production has fallen by 70% over the past two decades from 3.1 mb/d in 2005 to 0.9 mb/d in 2024. Over the five-year period from 2020 to 2024, Venezuela completed only 190 new oil wells. By comparison, the country completed 1,560 in 2007 alone.
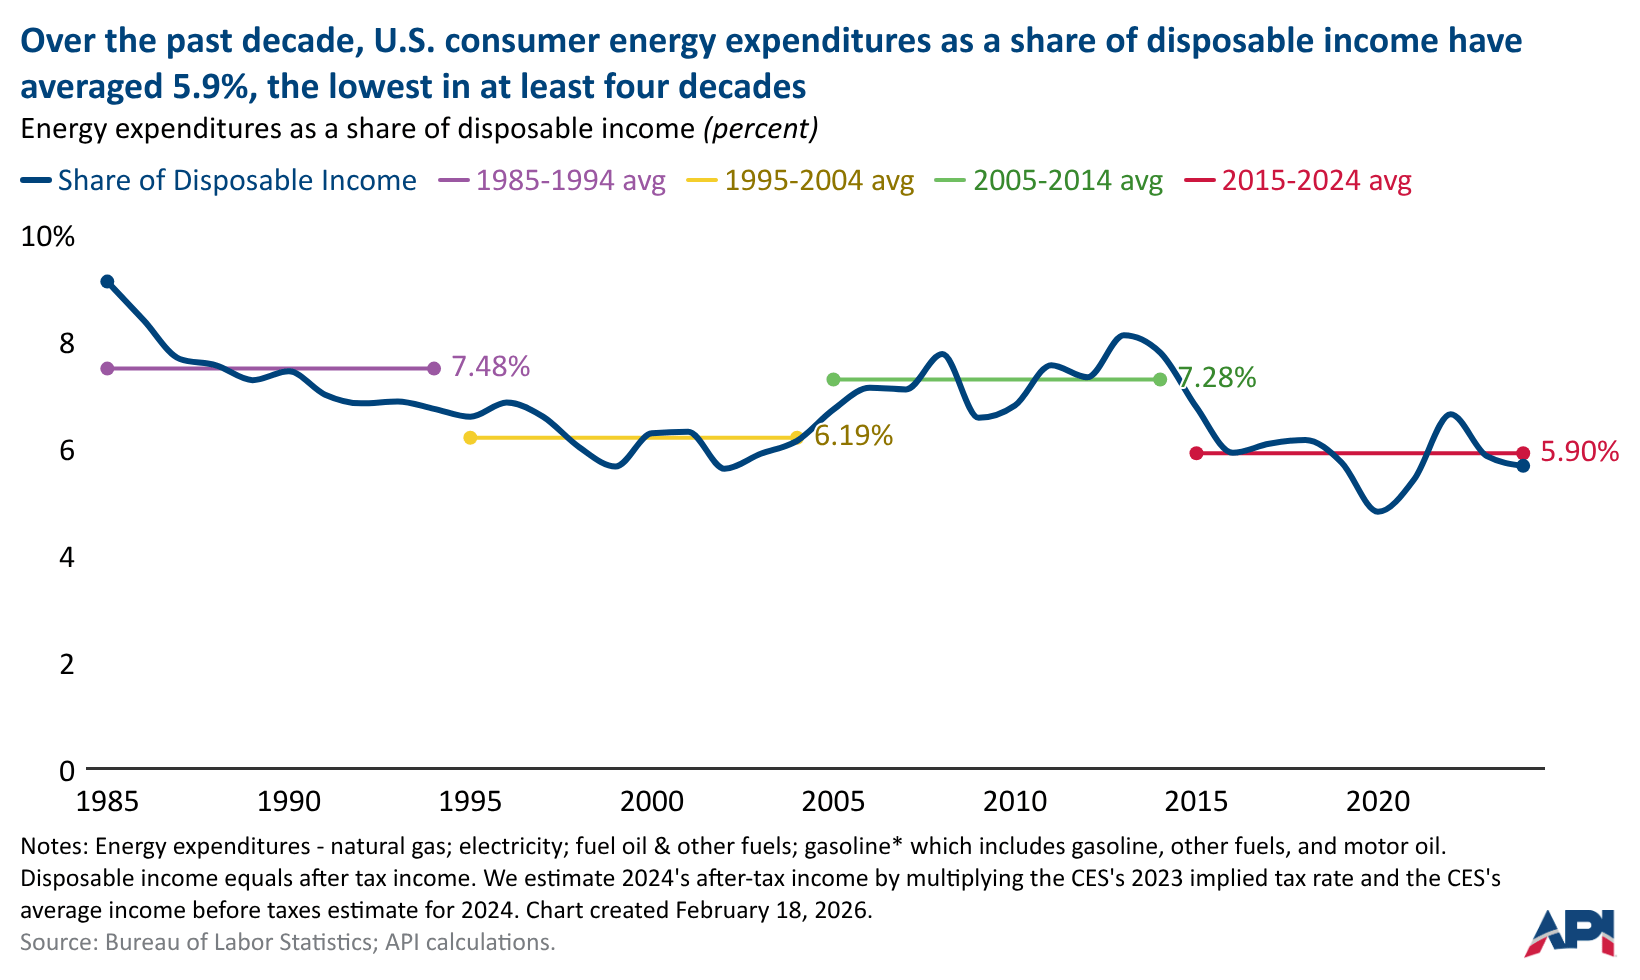
In 2024, consumers spent the equivalent of ~5.7% of their disposable income on gasoline, natural gas, electricity, fuel oil, and other fuels. This is down from a high of 10% in 1984.
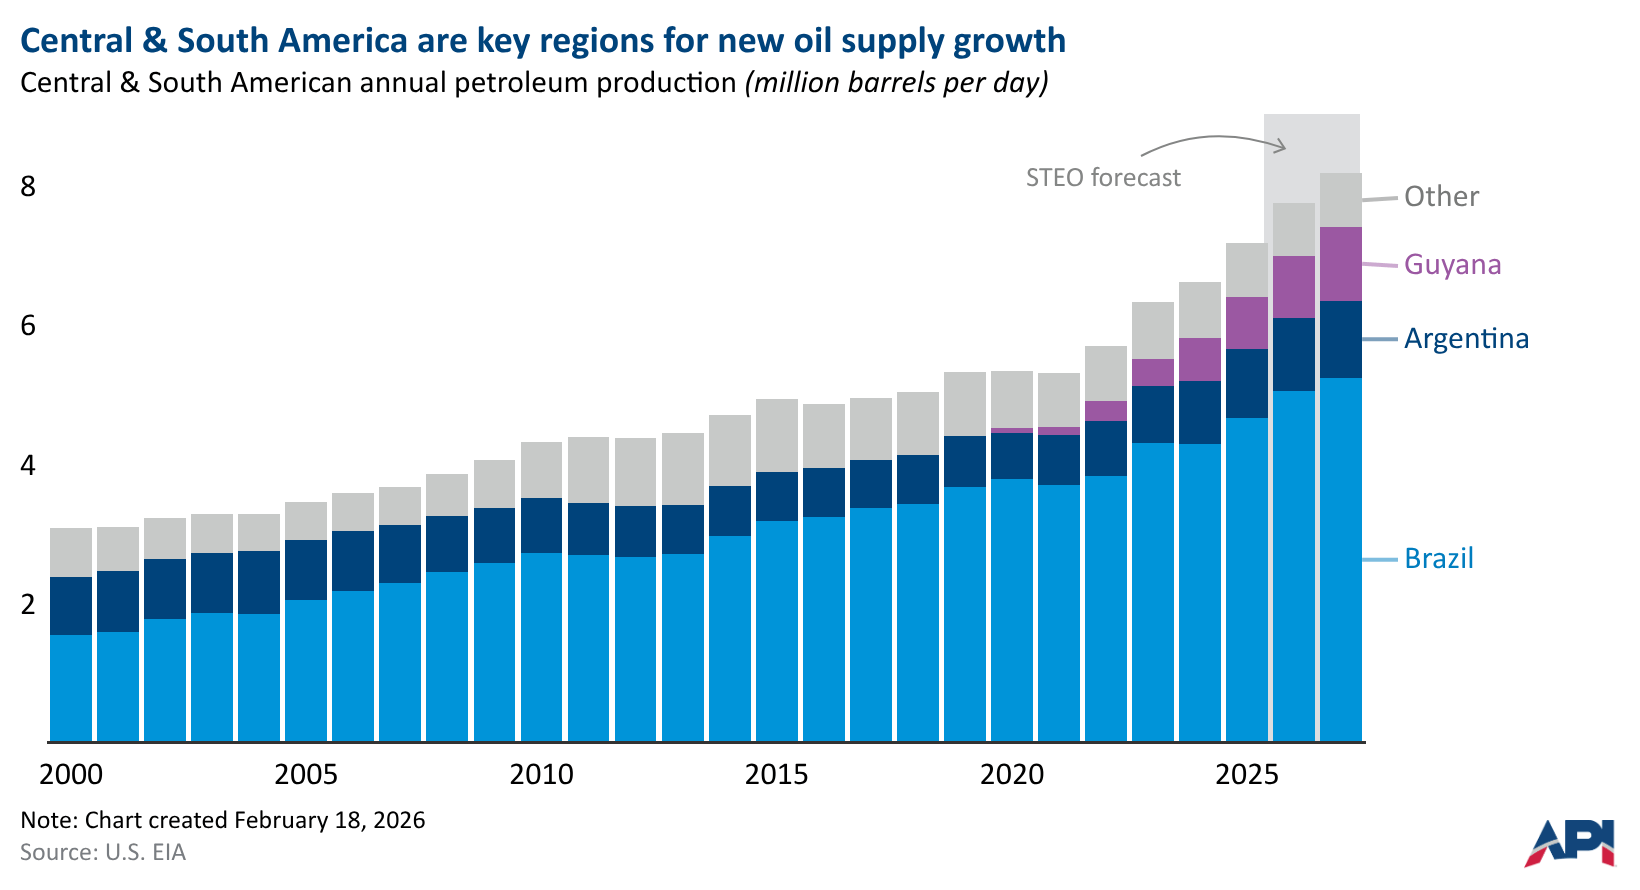
Brazil, Argentina, and Guyana are all expected to produce record highs of crude oil and other liquids next year. Combined, these three countries are forecast to produce ~7.4 million b/d in 2027, accounting for 10% of total non-OPEC production.
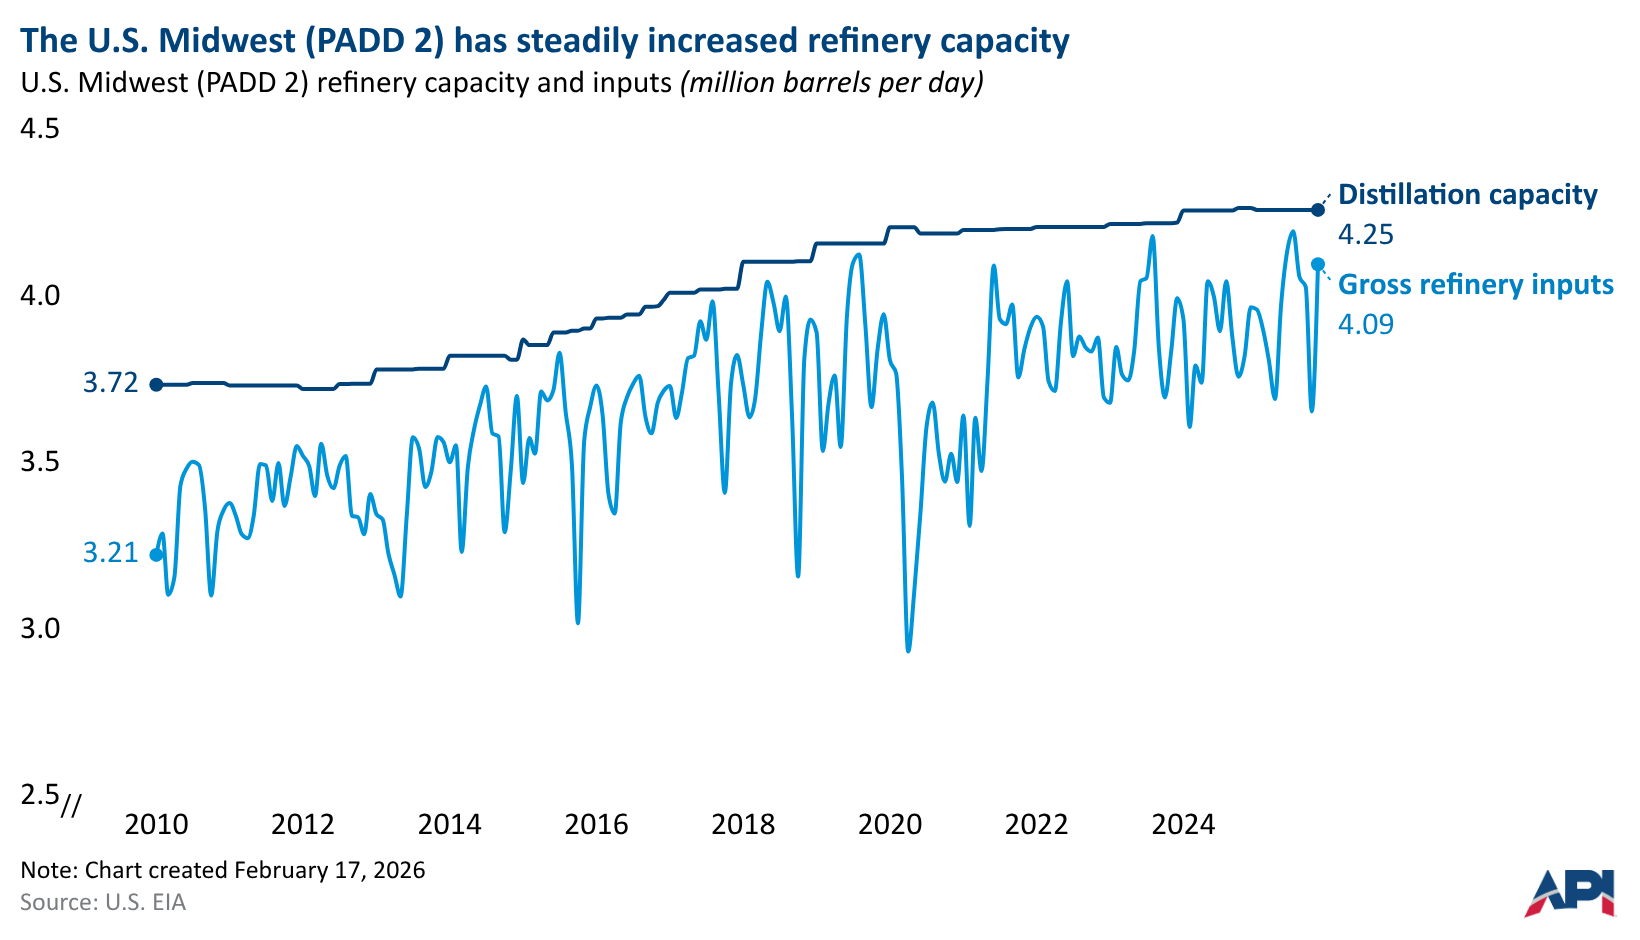
Since 2010, PADD 2 refinery capacity has increased ~500 kb/d (14%). Consumption in the region has also increased by ~200 kb/d (4%), but the larger increase in petroleum product production means the region receives fewer refined products shipped in from other regions.
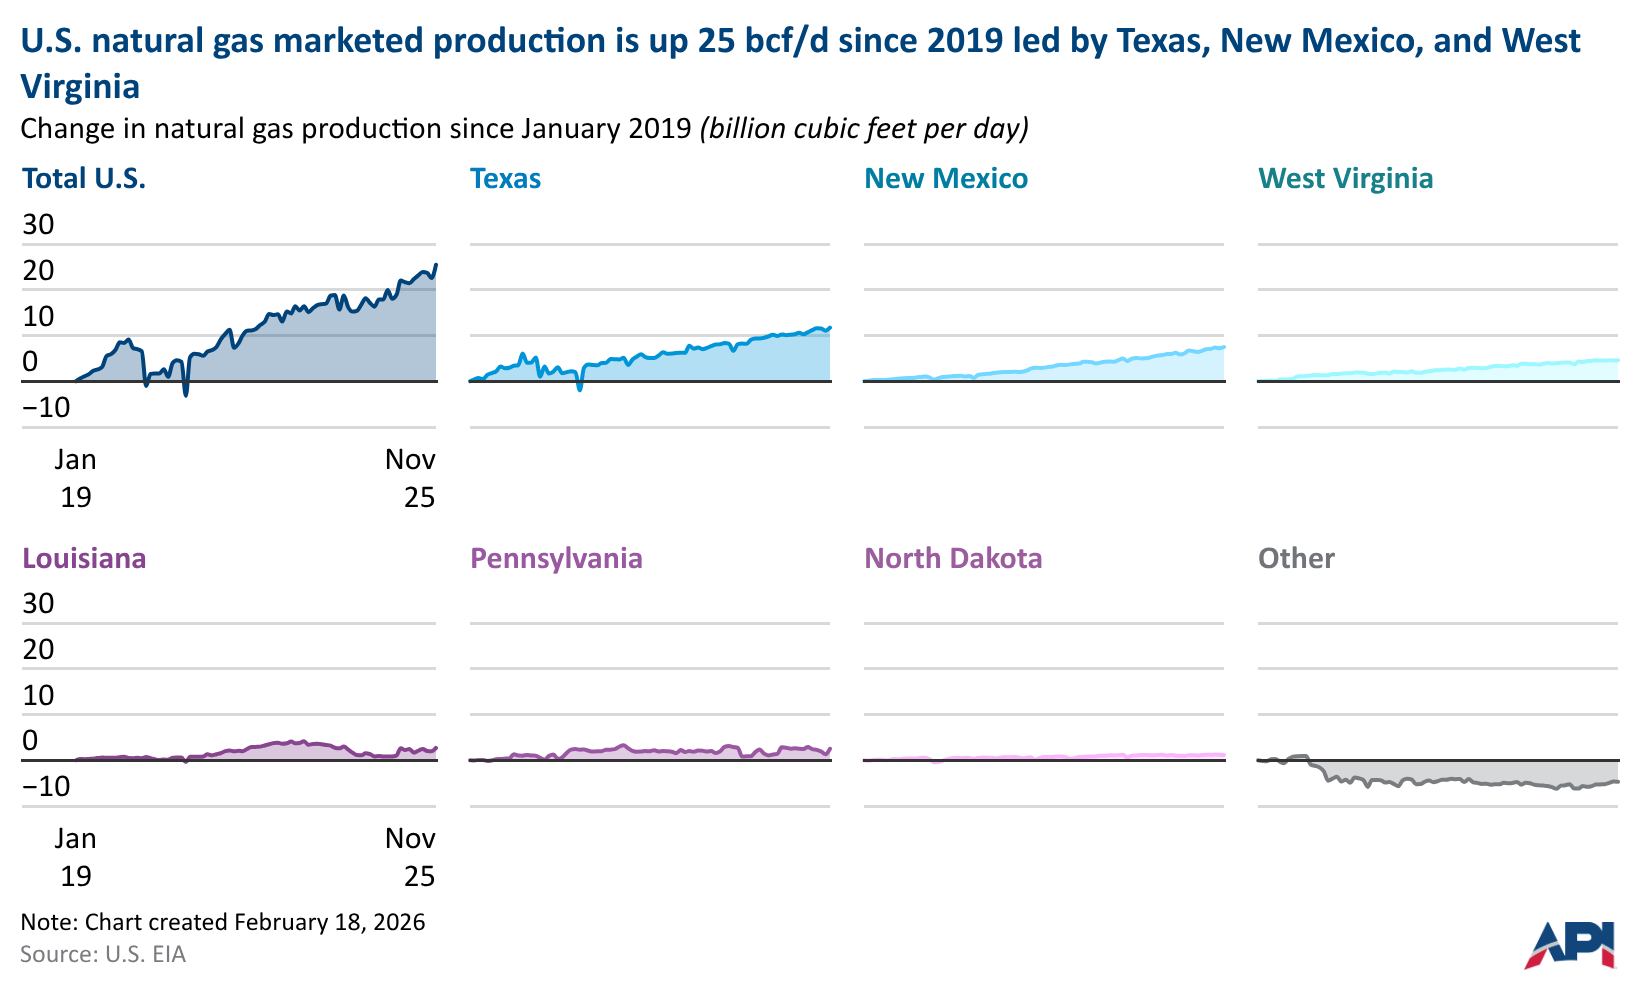
U.S. natural gas marketed production has increased by 25 bcf/d since January 2019. Texas, New Mexico, and West Virginia have accounted for 94% of the net growth.
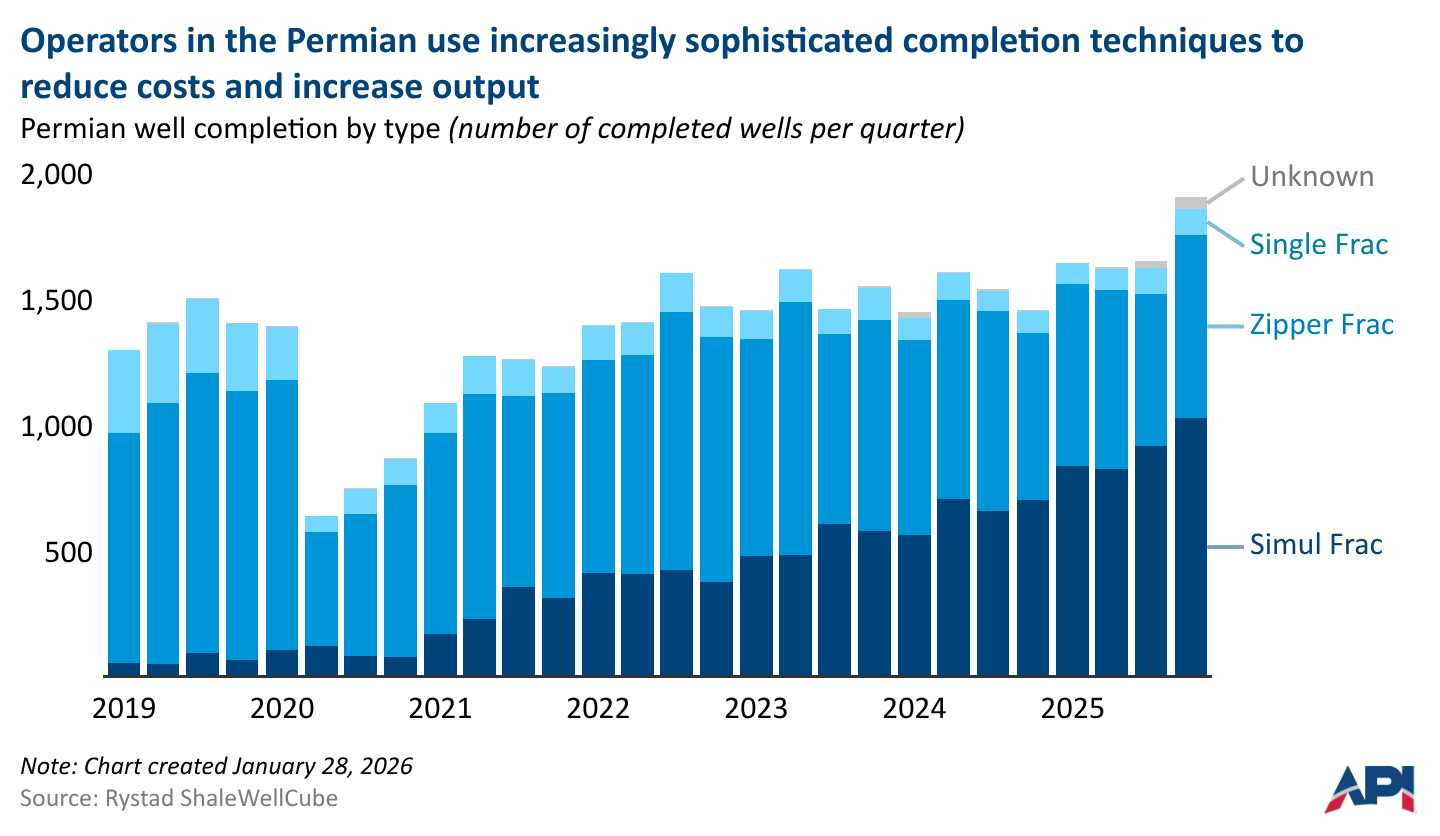
U.S. operators in the Permian region of Texas and New Mexico completed ~3,600 wells in 2025 using simultaneous hydraulic fracturing (simul frac), a technique that minimizes completion crew time on well pad sites by completing two wells simultaneously.
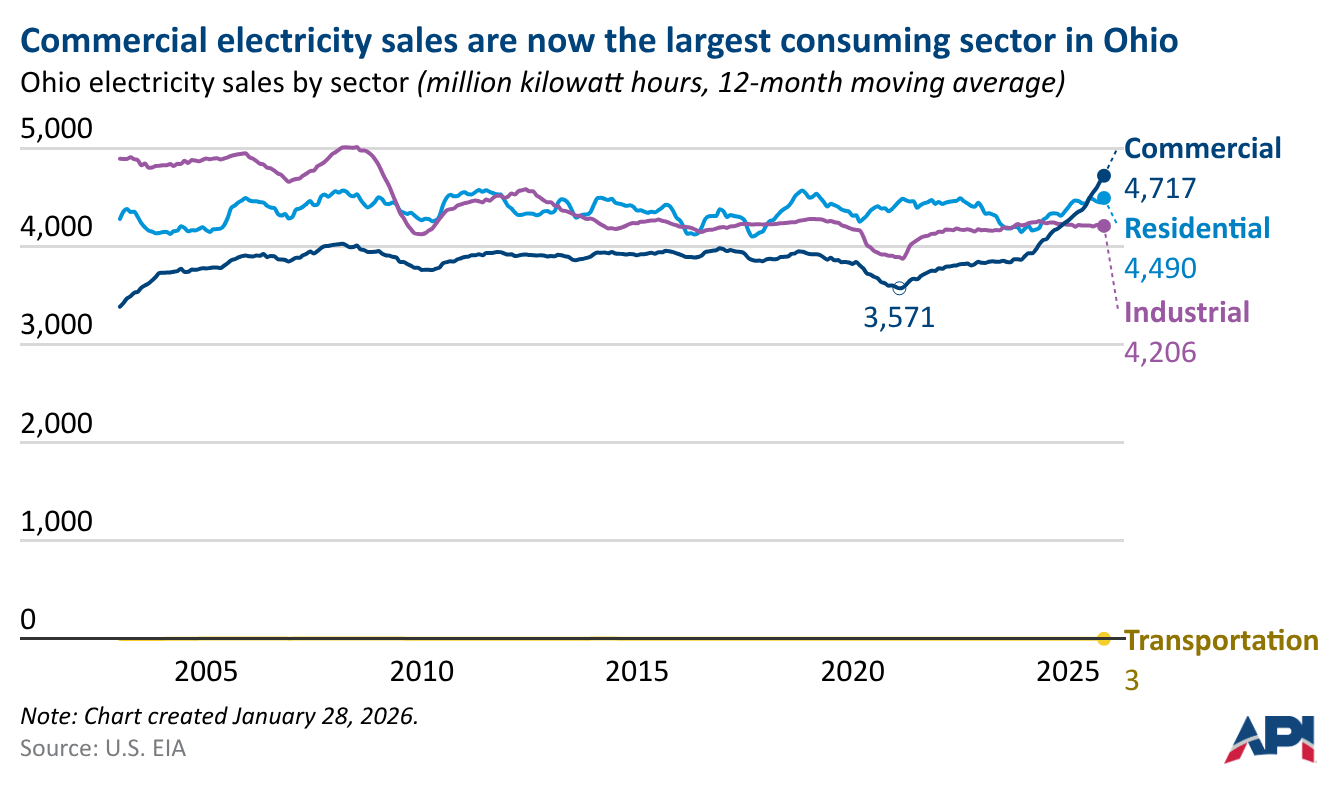
Ohio's commercial electricity sales surpassed residential sales for the first time on a twelve-month moving average basis in August 2025 and now account for 35% of all electricity sales in the state. This surge in electricity demand has contributed to tighter natural gas balances in the state. Natural gas consumption was 3.7 billion cubic feet per day (bcf/d) in October 2025, near an all-time high for the state and driven by growth in natural gas consumption for electric power.