When Iran closed the Strait of Hormuz, gasoline prices in California rocketed higher. In West Texas, spot prices for natural gas have been negative for months. And in Boston, winter heating bills have been higher than in nearby states, despite its proximity to natural gas producing regions.
Three energy markets with different problems, but one cause — not enough energy infrastructure.
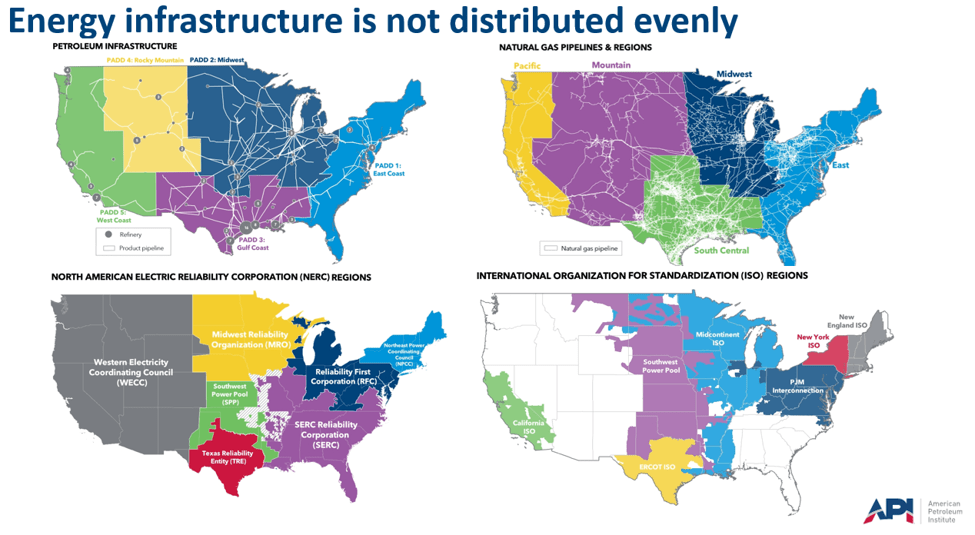
As conversations around federal permitting reform ramp up on Capitol Hill, this week’s American Energy Snapshot looks at three cases that illustrate how missing energy infrastructure, like pipelines, can affect prices — and why building more is so important for making energy more affordable.
New England is only around 100 miles from the largest gas field in North America — the Marcellus. But proximity does not guarantee access. When the temperature drops and demand rises, limited pipeline connections can restrict how much natural gas reaches cities like Boston, putting upward pressure on regional prices.
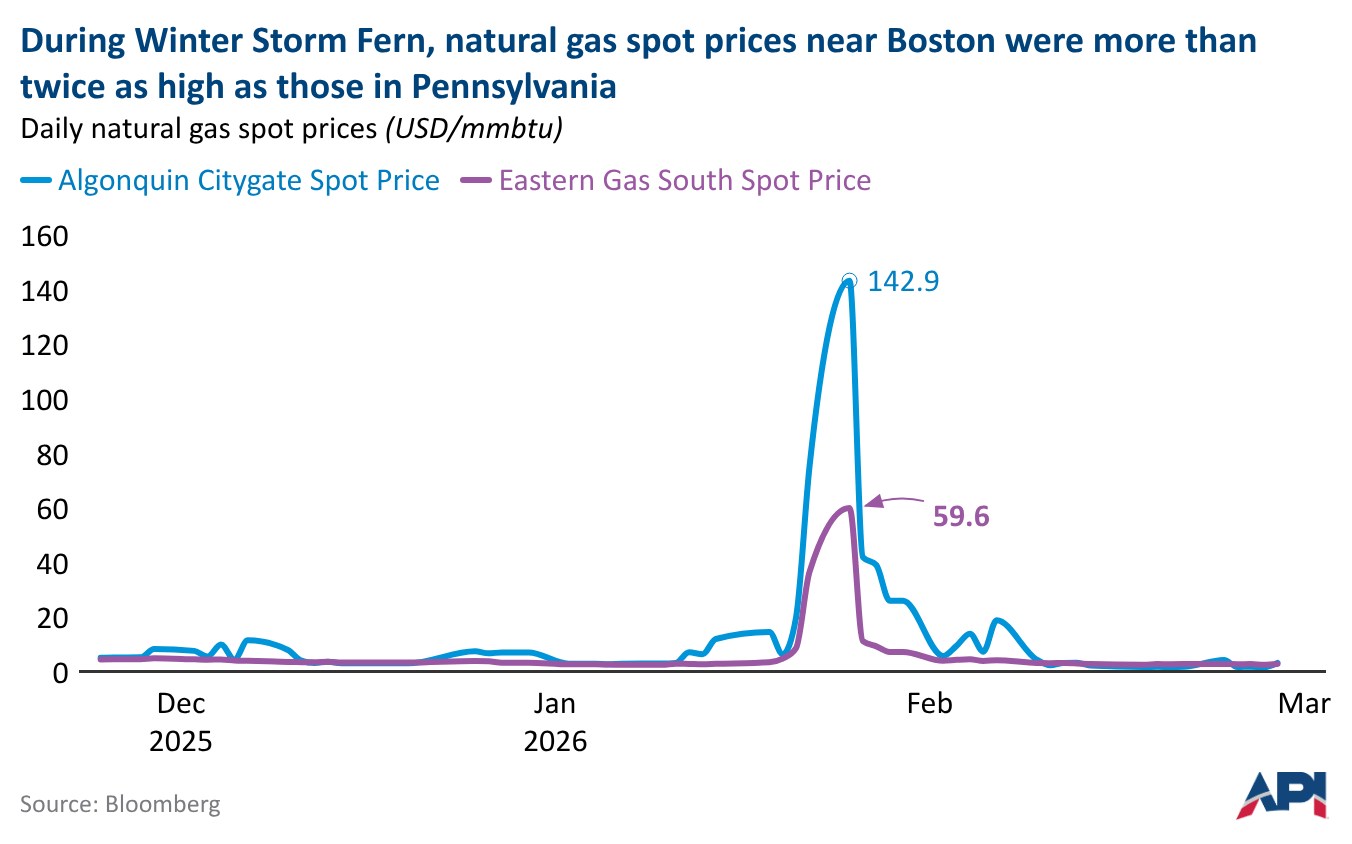
During the week of January 26, 2026, the natural gas price at Algonquin Citygate, which serves Boston-area consumers, reached $143 per million British thermal units (BTUs). Eastern Gas South in Pennsylvania, near Appalachian production, was $60.
That price difference is the infrastructure constraint, expressed in dollars. Pipeline capacity into New England is limited, so when demand has risen, consumers there have paid premium prices for gas produced a few hours' drive away.
West Texas shows a different side of the same problem. Waha, a natural gas hub near Permian Basin production, sits in one of the most productive energy regions in the country.
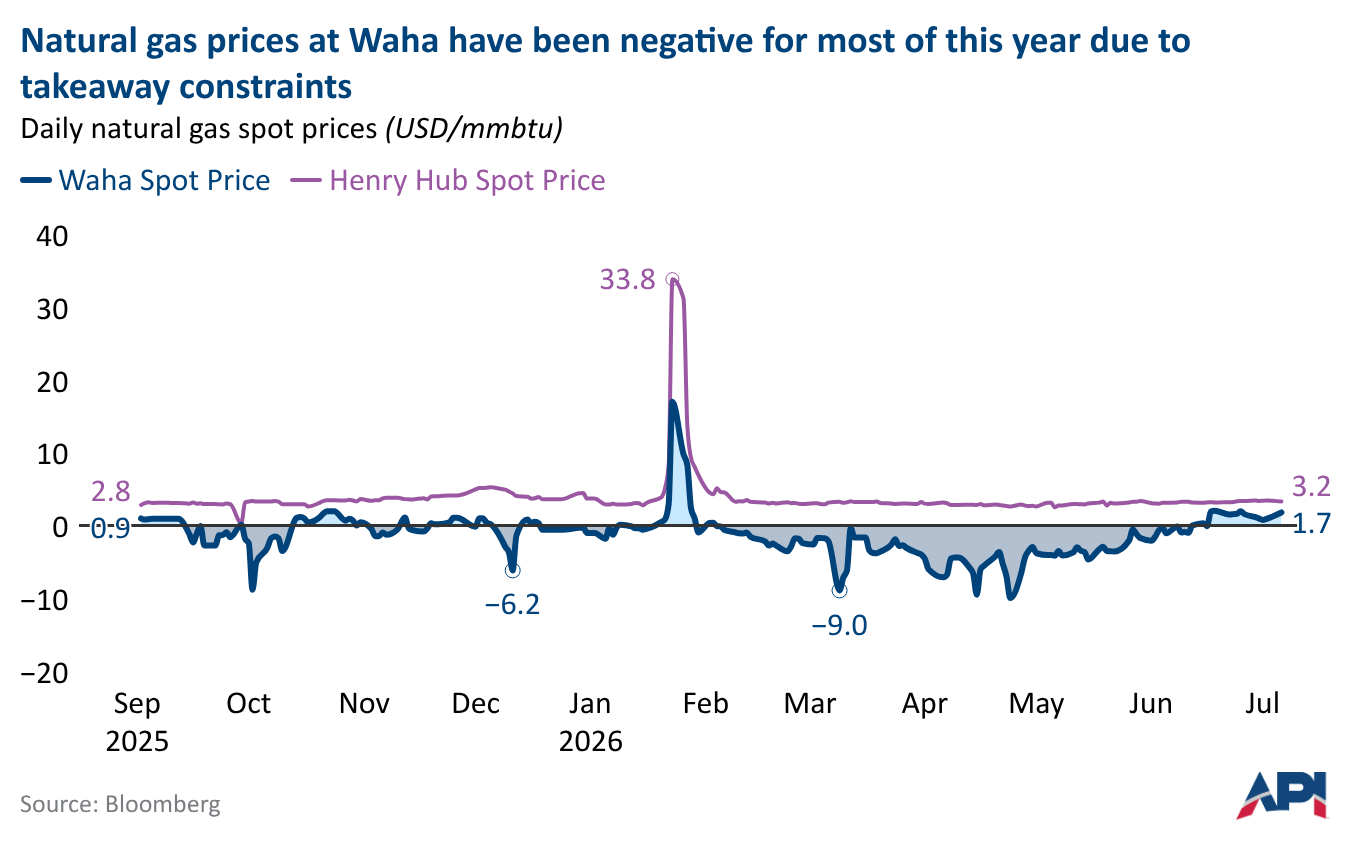
But natural gas production in that region has grown faster than pipeline capacity to take it away. As a result, local prices have often collapsed and frequently have gone negative. So far this year, Waha prices have traded below zero for 102 out of 126 trading days because Permian natural gas production outpaced takeaway capacity.
The region has plenty of gas — what it lacks is the connectivity to move it to places that could use it.
Historically, California sat largely apart from the broader U.S. energy system. In-state crude oil production and in-state refineries kept California reasonably well supplied, and formidable mountain ranges like the Sierra Nevadas made pipeline connections to other regions costly.
However, in recent years, state policy choices have shut down some California refineries and reduced in-state oil production. As a result, California is now dependent on seaborne imports for much of its crude oil, and has to frequently import fuels.
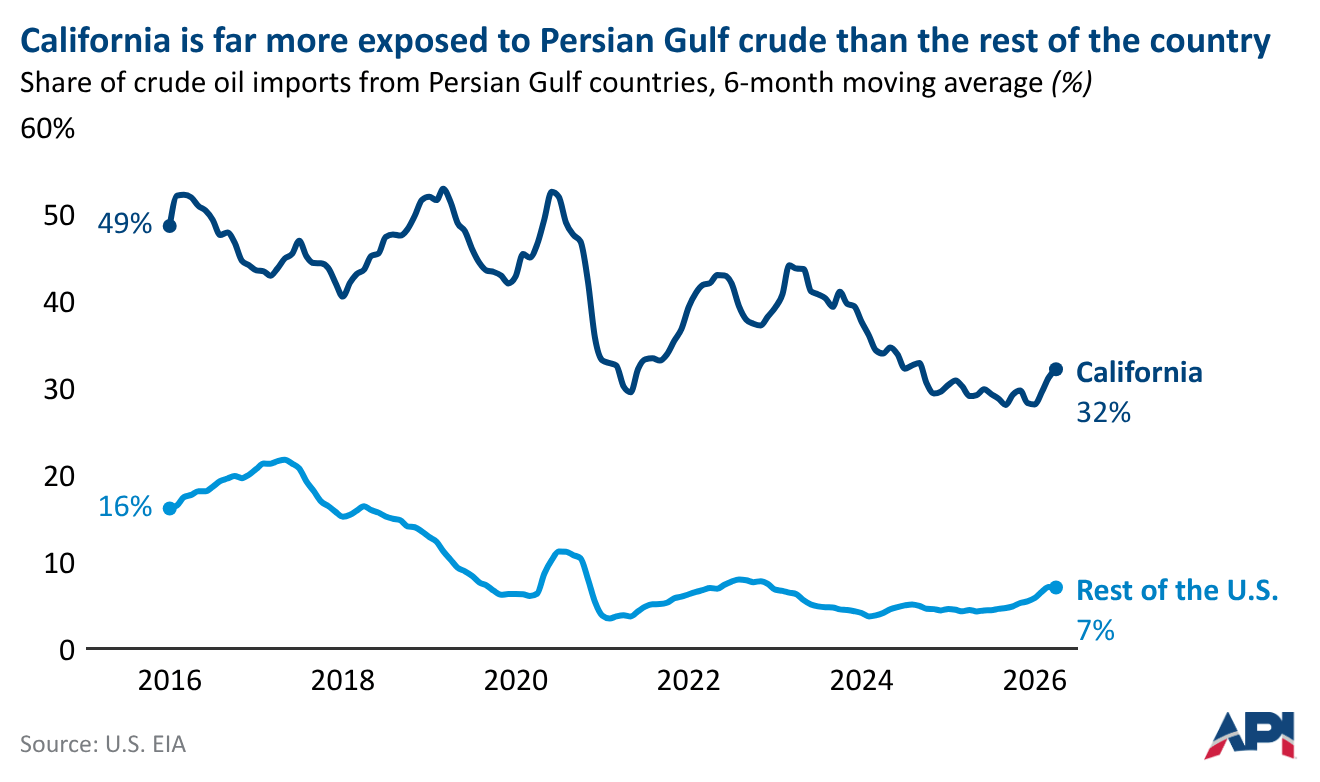
The numbers show how significant that dependence became. In 2025, the Middle East supplied just 8% of total U.S. crude oil imports, but nearly half of those barrels (47%) landed on the West Coast. California refineries received 61% of their crude from foreign sources that year. When the disruption cut those flows, replacement barrels had to travel farther, cost more and compete with buyers around the world.
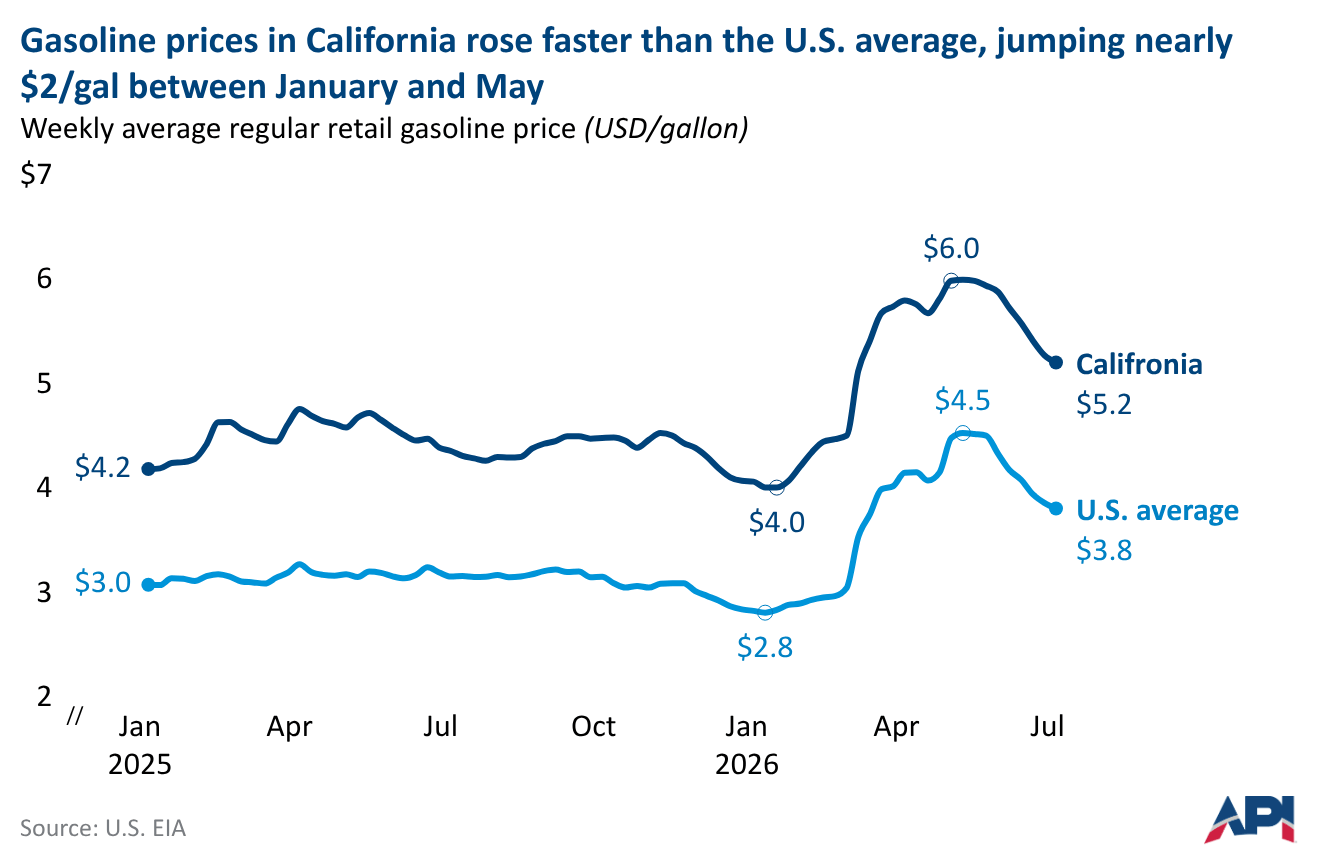
Drivers paid for that lack of infrastructure. When the Strait of Hormuz closed and global markets tightened, the average price of gasoline in California rose almost $2.00 per gallon — among the largest per-gallon increases in the country, on top of what were already the highest prices in the nation.
Recently, several petroleum pipeline projects were announced to better connect California to the rest of the country. But, those pipeline projects will face the familiar challenge of the federal permitting process, which has historically created years-long delays and even caused projects to be canceled. Meanwhile, California continues to sit in a precarious supply position.
Each of these regional examples point to the same lesson: strong domestic energy production can help lessen the impact of market disruptions, but only if energy infrastructure connects that production to places where there is demand.
That is why federal permitting reform is so important. A faster, more predictable permitting process would help build the pipelines, transmission projects, LNG facilities and other infrastructure needed to move American energy where consumers need it.