GWSDAT Version 3.3 now released!
GWSDAT is an open source, user-friendly, software application for the visualisation and interpretation of groundwater monitoring data. It also enables to work with other types of monitoring data collected over time and space (e.g. soil gas concentrations).
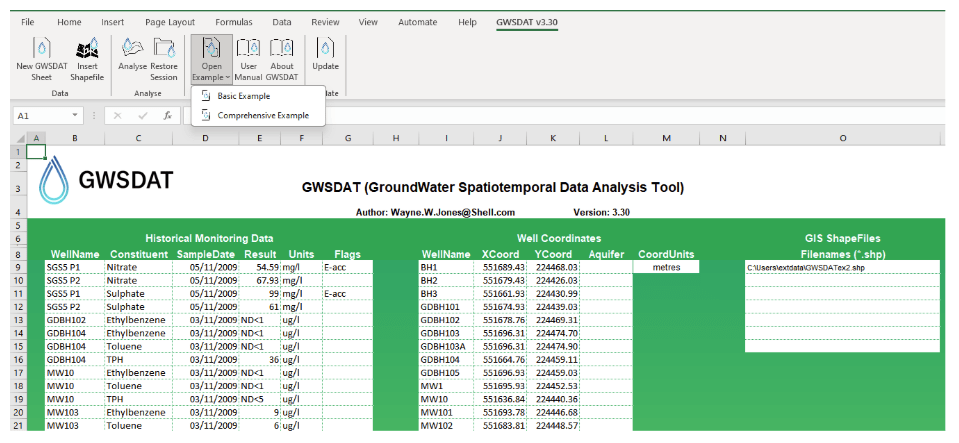
The GroundWater Spatiotemporal Data Analysis Tool (GWSDAT) has been developed by Shell Global Solutions for the analysis of groundwater monitoring data. It is designed to work with simple time-series data for solute concentration and ground water elevation but can also plot non-aqueous phase liquid (NAPL) thickness if required. Spatial data is input in the form of well coordinates, and wells can be grouped to separate data from different aquifer units. The software also allows the import of a site basemap in GIS shapefile format. Concentration trend and 2D contour plots generated using GWSDAT can be exported directly to Microsoft PowerPoint and Word to expedite reporting.
The application is supported for Windows 8,10 & 11 and the corresponding version of Microsoft Office (including 64-bit operating systems). Data input to GWSDAT is via a standardized Excel spreadsheet and the data analysis and plot functions are accessed through an Excel Add-in application. The statistical engine used to perform geo-statistical modelling and display graphical output is the open-source statistical programming language R (www.r-project.org). A user manual and two example datasets are provided with the software for training and demonstration purposes.
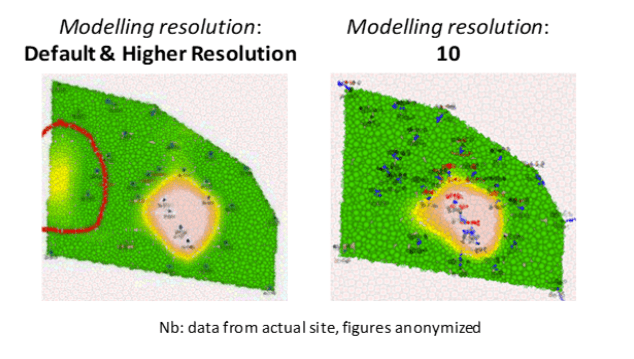
The modelling of solute distribution in groundwater is typically restricted to either the analysis of trends in individual wells or independent fitting of spatial concentration distributions (e.g. by Kriging) to data from monitoring events. Neither of these techniques satisfactorily elucidate the interaction between spatial and temporal components of the data. GWSDAT applies a spatiotemporal model smoother for a more coherent and smooth interpretation of the interaction in spatial and time-series components of groundwater solute concentrations. A spatiotemporal concentration smoother is fitted for each analyte using a non-parametric regression technique known as Penalised Splines (Eilers and Marx, 1992, 1996). A Bayesian methodology is used to select the appropriate degree of model smoothness (Evers et al, 2015). The fit of the spatiotemporal algorithm to the monitoring data can be evaluated.
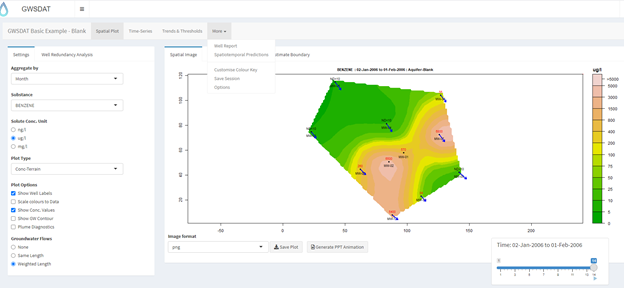
The GWSDAT graphical user interface (GUI) allows the user to navigate through a groundwater dataset and explore concentration/ groundwater elevation trends in individual wells and across the site. Several options are available to customize the display and data analysis. Note that plots can also be automatically exported.
GWSDAT includes the following tools for trend visualization and detection:
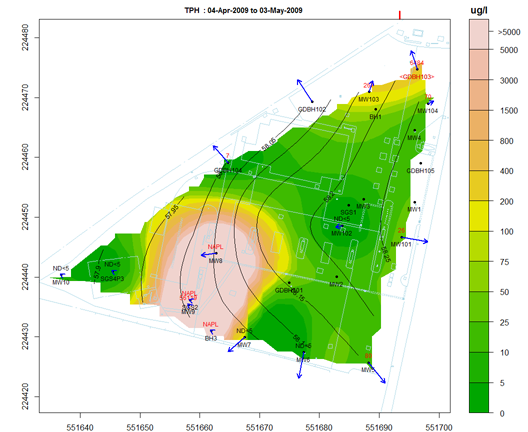
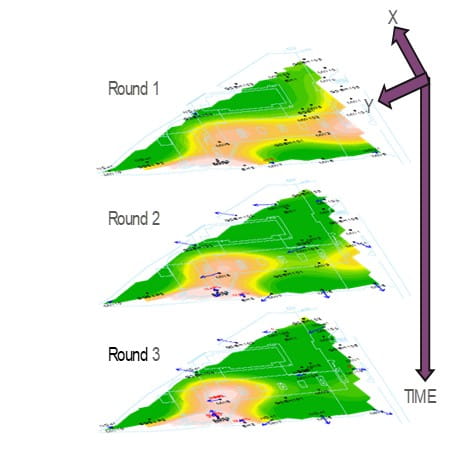
Spatial plot: For the analysis of spatial trends in solute concentrations, groundwater flow and, if present, NAPL thickness. Overlaid on this plot are the predictions of the spatiotemporal solute concentration smoother which is a function that simultaneously estimates both the spatial and time series trend in site solute concentrations. GIS shapefiles can also be overlaid on this plot.
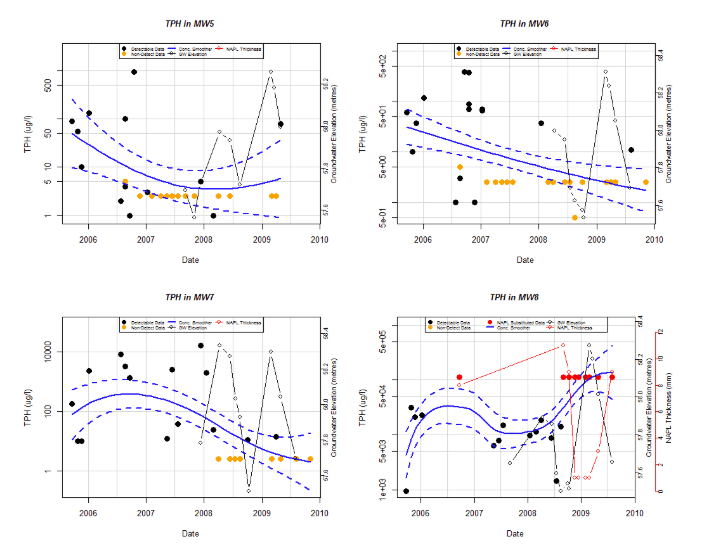
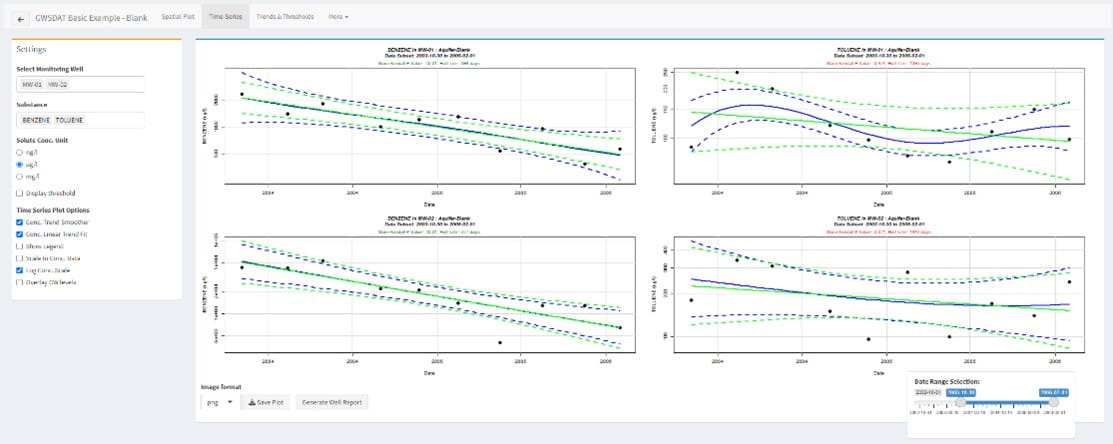
Well Trend plot: For the investigation of historical time-series trends in solute concentrations, groundwater elevation and, if present, NAPL thickness for individual wells. Users can overlay a nonparametric smoother which estimates the time-series trend in solute concentration. The advantage of this nonparametric method is that the trend estimate is not constrained to be monotonic, i.e. the trend can change direction.

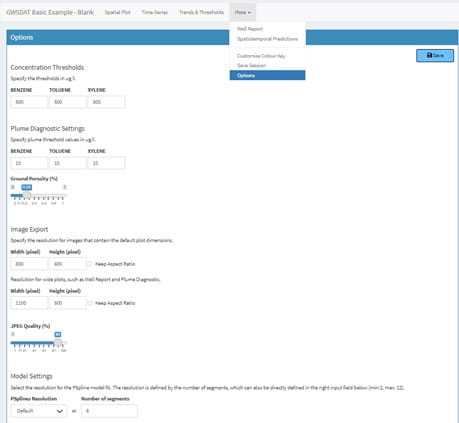
Trend and Threshold Indicator Matrix: This feature provides a summary of the level and time series trend in solute concentrations at a particular model output interval.
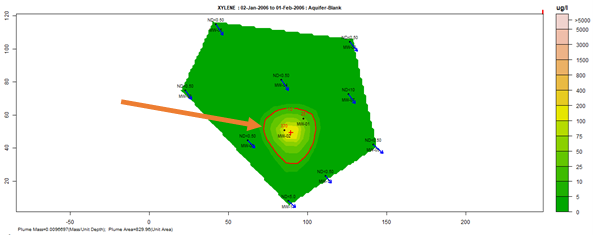
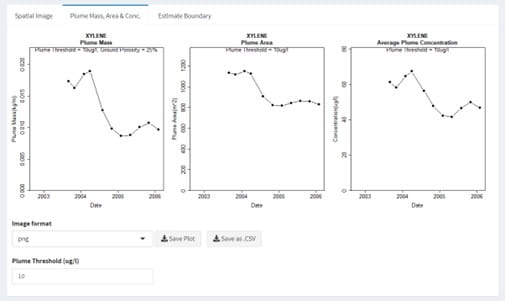
Plume diagnostics plots: This feature enables to calculate and display plume diagnostic quantities (area, mass, concentration) for a delineated plume displayed with a solid red contour line.
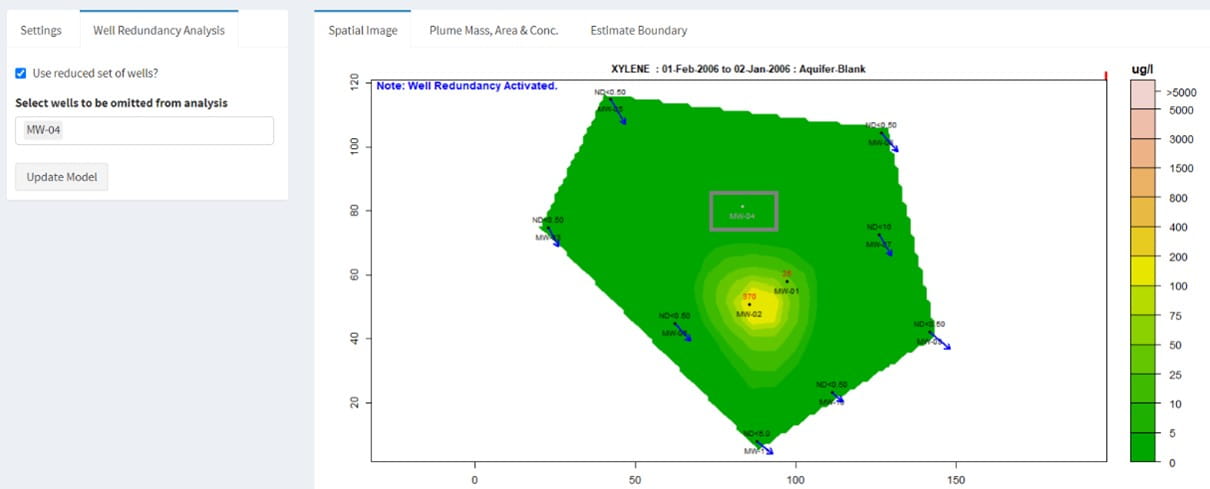
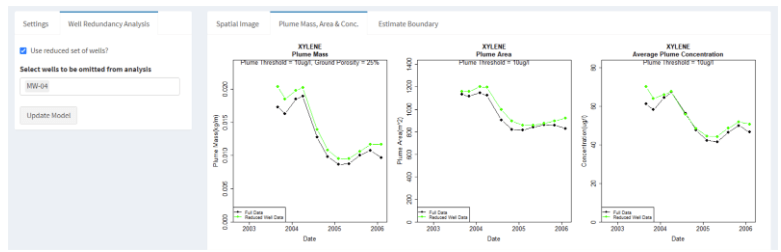
Well redundancy: This feature enables users to very conveniently drop a well or a combination of wells from the analysis and investigate the resultant impact.
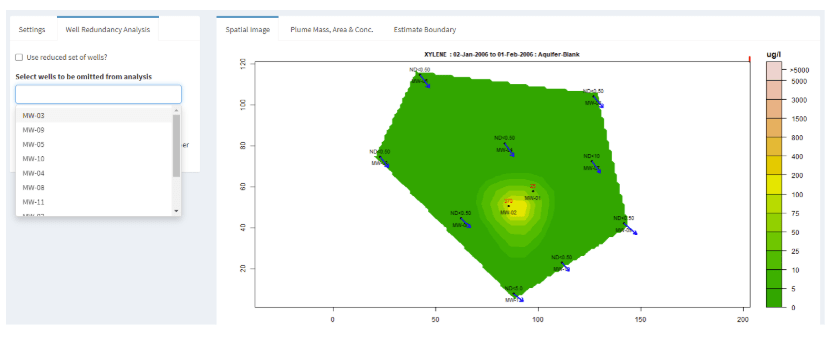
Building on the existing well redundancy analysis feature, GWSDAT now provides an ordered well omission list such that the wells estimated to have the least influence are presented first. This offers users more assistance in assessing which monitoring wells may be the most suitable for future omission and eventual decommissioning. This well influence order is established via a procedure fully documented here and here.
The authors gratefully acknowledge those people who have contributed their knowledge and time to the development of GWSDAT. The authors wish to express their gratitude to Adrian Bowman, Ludger Evers, Daniel Molinari, Claire Miller, Marnie Low, Peter Radvanyi, and Craig Alexander from the department of Statistics, University of Glasgow, for their invaluable contributions to the development of the spatiotemporal algorithm. Thanks also to Ewan Mercer from the University of Glasgow for his assistance in the development of the GWSDAT user interface. We acknowledge and thank the R project for Statistical Computing and all its contributors without which this project would not have been possible. A big thank you to Shell's worldwide environmental consultants for assistance in evaluating and testing the earlier versions of GWSDAT. Thanks also to the Shell Year in Industry students who spent a great deal of time testing GWSDAT and making suggestions for improvements. We thank both current and former colleagues including Matthew Lahvis, Jonathan Smith, George Devaull, Dan Walsh, Curtis Stanley, Marco Giannitrapani and Philip Jonathan for their support, vision and advocacy of GWSDAT.
The GWSDAT V3.3 Excel Add-in has a new simpler installation procedure where all files are bundled together, and you don’t need admin rights to install the software. Before attempting installation, it is recommended to read the article here for more information on Excel Trusted Locations and add-in troubleshooting. A video demonstrating end to end installation can be found here.
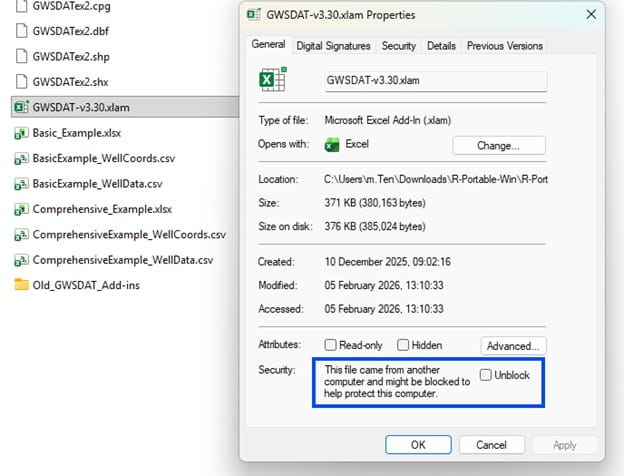
If the “GWSDAT v3.3” menu does not appear in Excel or an add-in error occurs, then follow the steps in this article here. Most commonly, the solution here is to unblock the add-in file. Navigate to “C:\Users\User.Name\AppData\Local\GWSDAT\R-Portable-Win\R-Portable-Win\library\GWSDAT\extdata” folder and check the file “GWSDAT V3.3.xlam” isn’t blocked by doubling click on it. If it is blocked then right click the file, select properties and check the unblock check as seen in the screenshot below.
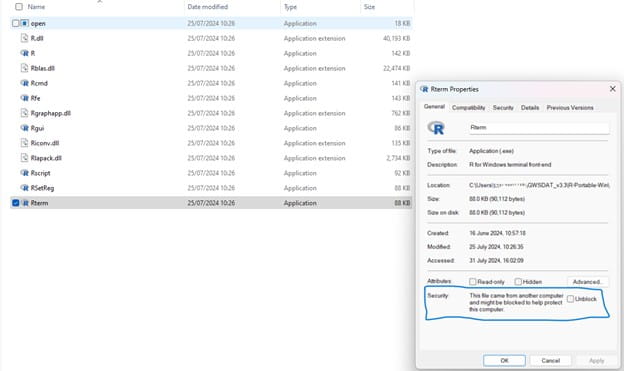
If the “GWSDAT v3.3” menu is visible, but nothing happens when you run the example then please navigate to “C:\Users\User.Name\AppData\Local\GWSDAT\R-Portable-Win\R-Portable-Win\bin\x64” and check the file “Rterm.exe” isn’t blocked. You can check it isn’t blocked by double clicking on the file. If it is blocked then right click the file, select properties and check the unblock check as seen in below screenshot
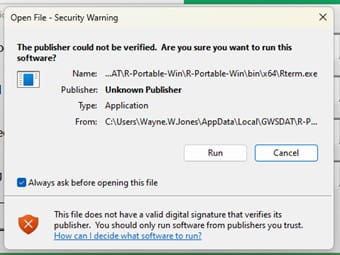
You may see a security warning – as screenshot below – click run to proceed and uncheck “Always ask before opening this file” to stop this message appearing in the future.
Please see http://gwsdat.net/gwsdat_manual/ for comprehensive user manual and supporting material. To report any software issues or bugs please fill in the user feedback form here: www.gwsdat.net/feedback.
Please note that the API / Shell Global Solutions do not provide consultancy on data interpretation or use of the GWSDAT software.
File Type: pdf | File Size: 136 KB

