


API MSR: Glimmer of Light for Oil Markets?

Dean Foreman
Posted May 14, 2020
API’s latest Monthly Statistical Report (MSR) has positive news; it just takes a close look to find it.
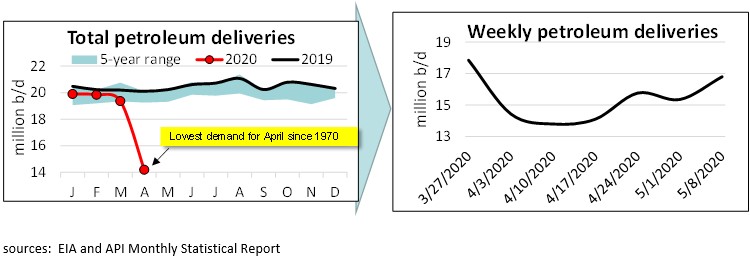
One example: Weekly petroleum demand data (MSR and U.S. Energy Information Administration), as measured by total domestic petroleum deliveries, indicates that the worst impacts on our industry from COVID-19 and measures to contain it may be behind us, occurring in mid-April.
We won’t know for sure until we see data for May in next month’s MSR. But EIA’s Weekly Petroleum Status Report (WPSR), shows that demand rebounded by 3.0 million barrels per day (mb/d) as of May 8, from the low point in the week of April 10 (lowest demand for April since 1970). With more than 30 states in various stages of re-opening, demand could be expected to increase along with rising economic activity.
That said, the MSR (April data) shows the impacts associated with COVID-19 were significant with several record lows recorded:
- As U.S. oil-directed drilling fell by a record 52% over last two months, total U.S. liquids (crude oil, natural gas and other liquids) production decreased by 1.6 mb/d, the most ever since API started this report 44 years ago.
- Total petroleum demand of 14.2 mb/d fell by 5.2 mb/d from March, with half of that drop coming from gasoline demand.
- Refinery throughput and capacity utilization had their largest declines on record since 1985.
- Crude oil prices fell by the largest percentage on monthly record since 1983, and West Texas Intermediate (WTI) crude oil futures crashed to a negative spot price on April 20, one day before the May futures contract expiration. WTI otherwise traded above international Brent crude oil for the month.
- U.S. petroleum imports fell by 1.8 mb/d, for a single month since 1973.
These data may be reflected upon for decades to come as low marks since they also quietly reveal a turn in the weekly pattern.
As mentioned above, U.S. petroleum demand decreased to 14.2 mb/d in April. This was a decrease of 26.7% from March and 29.4% compared with April 2019. Again, the lowest level for the month of April since 1970.
The decrease reflected the escalation of stay-at-home orders to prevent transmission of COVID-19. Transportation fuel deliveries fell across the board, but some fell more than others. Jet fuel was the most adversely affected, followed by gasoline and diesel/distillates.
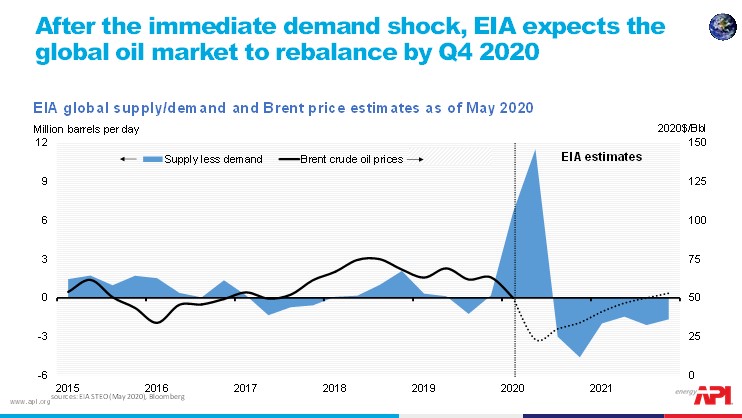
To be clear, the response to COVID-19 has mainly been driven by a sharp decrease in demand – though most of the policy focus has been on supply. Supply generally takes longer to respond to various factors than demand. EIA’s latest Short-term Energy Outlook is summarized below and indicates the world oil market could be short more than 4.5 million barrels per day of supply by the fourth quarter of 2020, which could mean another dramatic whipsawing of the market.
As the proverbial pendulum swings, API will continue to bring sound data and analysis.
About The Author
Dr. R. Dean Foreman is API’s chief economist and an expert in the economics and markets for oil, natural gas and power with more than two decades of industry experience including ExxonMobil, Talisman Energy, Sasol, and Saudi Aramco in forecasting & market analysis, corporate strategic planning, and finance/risk management. He is known for knowledge of energy markets, applying advanced analytics to assess risk in these markets, and clearly and effectively communicating with management, policy makers and the media.