


U.S. Petroleum Markets – July Progress and a Potential Turning Point

Dean Foreman
Posted August 21, 2020
We’re seeing cautious optimism in the news about oil markets, with crude’s comeback broadly continuing for a third consecutive month in July with the gradual re-opening of state economies. API’s Monthly Statistical Report (MSR) for August presents the latest details.
U.S. petroleum demand has clearly rebounded, albeit at a slowing growth rate. We see this as good news for staying on a positive track and reflective of progress made to overcome continued challenges with COVID-19.
Highlights from this month’s MSR shows, based on July data:
- U.S. petroleum demand of 18.3 million barrels per day (mb/d), led by motor gasoline, rose by 0.7 mb/d in July—roughly half of the increase experienced in June
- Refinery throughput (14.9 mb/d) and capacity utilization (78.6%) both rose in July, reinforcing expectations for continued demand recovery
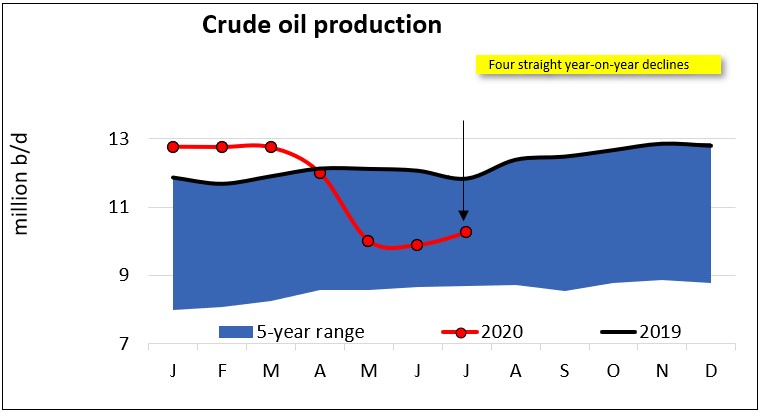
- With lower drilling activity, U.S. crude oil production was 10.3 mb/d – down by 2.6 mb/d from its peak in November 2019
- Crude oil and total inventories eased off of record highs
- Decreased U.S. petroleum imports drove U.S. petroleum net imports lower
source: API Monthly Statistical Report
A key chart this month shows what appeared to be a downshift of U.S. crude oil production to structurally lower levels, coming in at 10.3 million barrels per day (mb/d) in July along with oil-directed drilling activity that fell to 180 rigs for the month, its lowest since July 2009. This lower production reflected an increase of 0.4 mb/d from June, but down 2.6 mb/d from its peak at 12.9 mb/d in November 2019.
The lower crude oil production levels combined with higher demand and consequently refinery throughput helped inventories to recede from recent highs. However, with decreased domestic oil production, the U.S. remains a petroleum net importer for the third consecutive month.
So, there were positives and negatives for the U.S. in July. For the macroeconomy, we combine these data for API’s economic indicator, The D-E-I™, which is based primarily on diesel/distillate supply, demand and inventories.
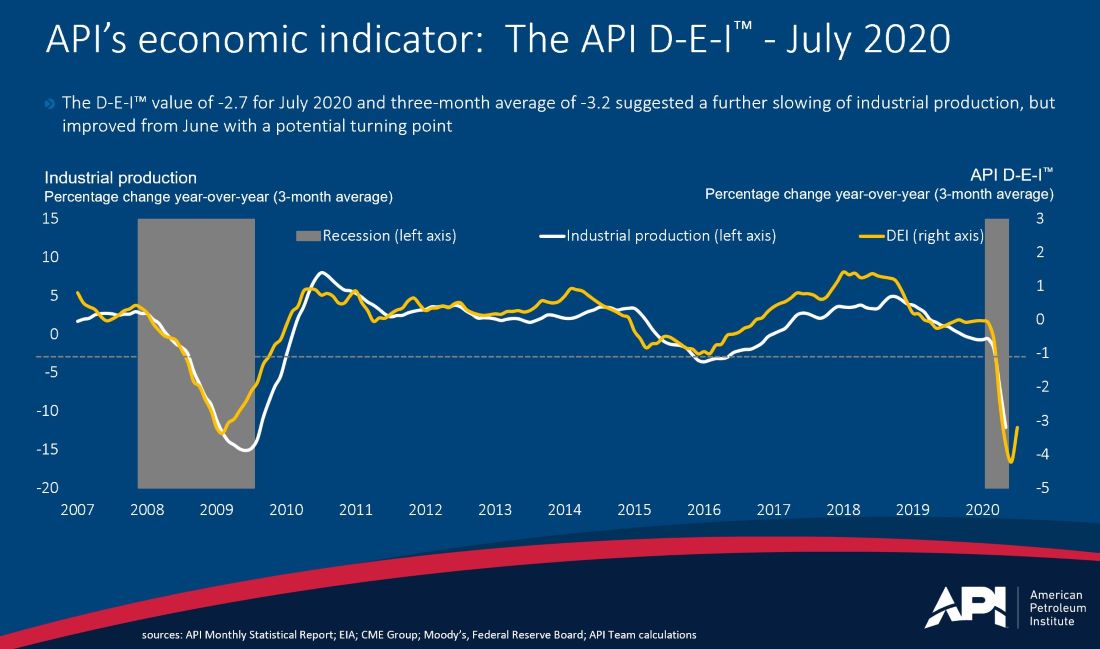
In July, The D-E-I™ posted a reading of -2.7 and a three-month average reading of -3.2, which historically has corresponded with slower U.S. industrial production and economic growth. However, the three-month average increased from -4.3 in June, suggesting relative improvement and a positive potential turning point.
Crude oil futures prices have reinforced this view with West Texas Intermediate (WTI) futures trading above $43 per barrel for December delivery and over $45 per barrel within 12 months, according to data from CME Group.
Overall, July marked continued progress toward the rebalancing of U.S. and global oil, with markets reflecting stabilizing supply and inventories, combined with measured increases in demand.
Again, there’s much progress yet to be made to return to pre-COVID-19 norms, and we continue to monitor the path the recovery and the economy. But July appeared to be a building block of progress and potential turning point on the economic front.
For details and analysis, please see the full API Monthly Statistical Report (MSR) for July, available free of charge here.
About The Author
Dr. R. Dean Foreman is API’s chief economist and an expert in the economics and markets for oil, natural gas and power with more than two decades of industry experience including ExxonMobil, Talisman Energy, Sasol, and Saudi Aramco in forecasting & market analysis, corporate strategic planning, and finance/risk management. He is known for knowledge of energy markets, applying advanced analytics to assess risk in these markets, and clearly and effectively communicating with management, policy makers and the media.